Bitcoin Bear Market Bottom Lays Ahead - Here's Why
Summer Range Breakdown Soon?
Welcome to the Rekt Capital Newsletter, a resource for investors who want to better navigate the crypto markets with the help of cutting-edge crypto research and unbiased market analysis
Is the ~$63000 Region Turning Into Resistance?
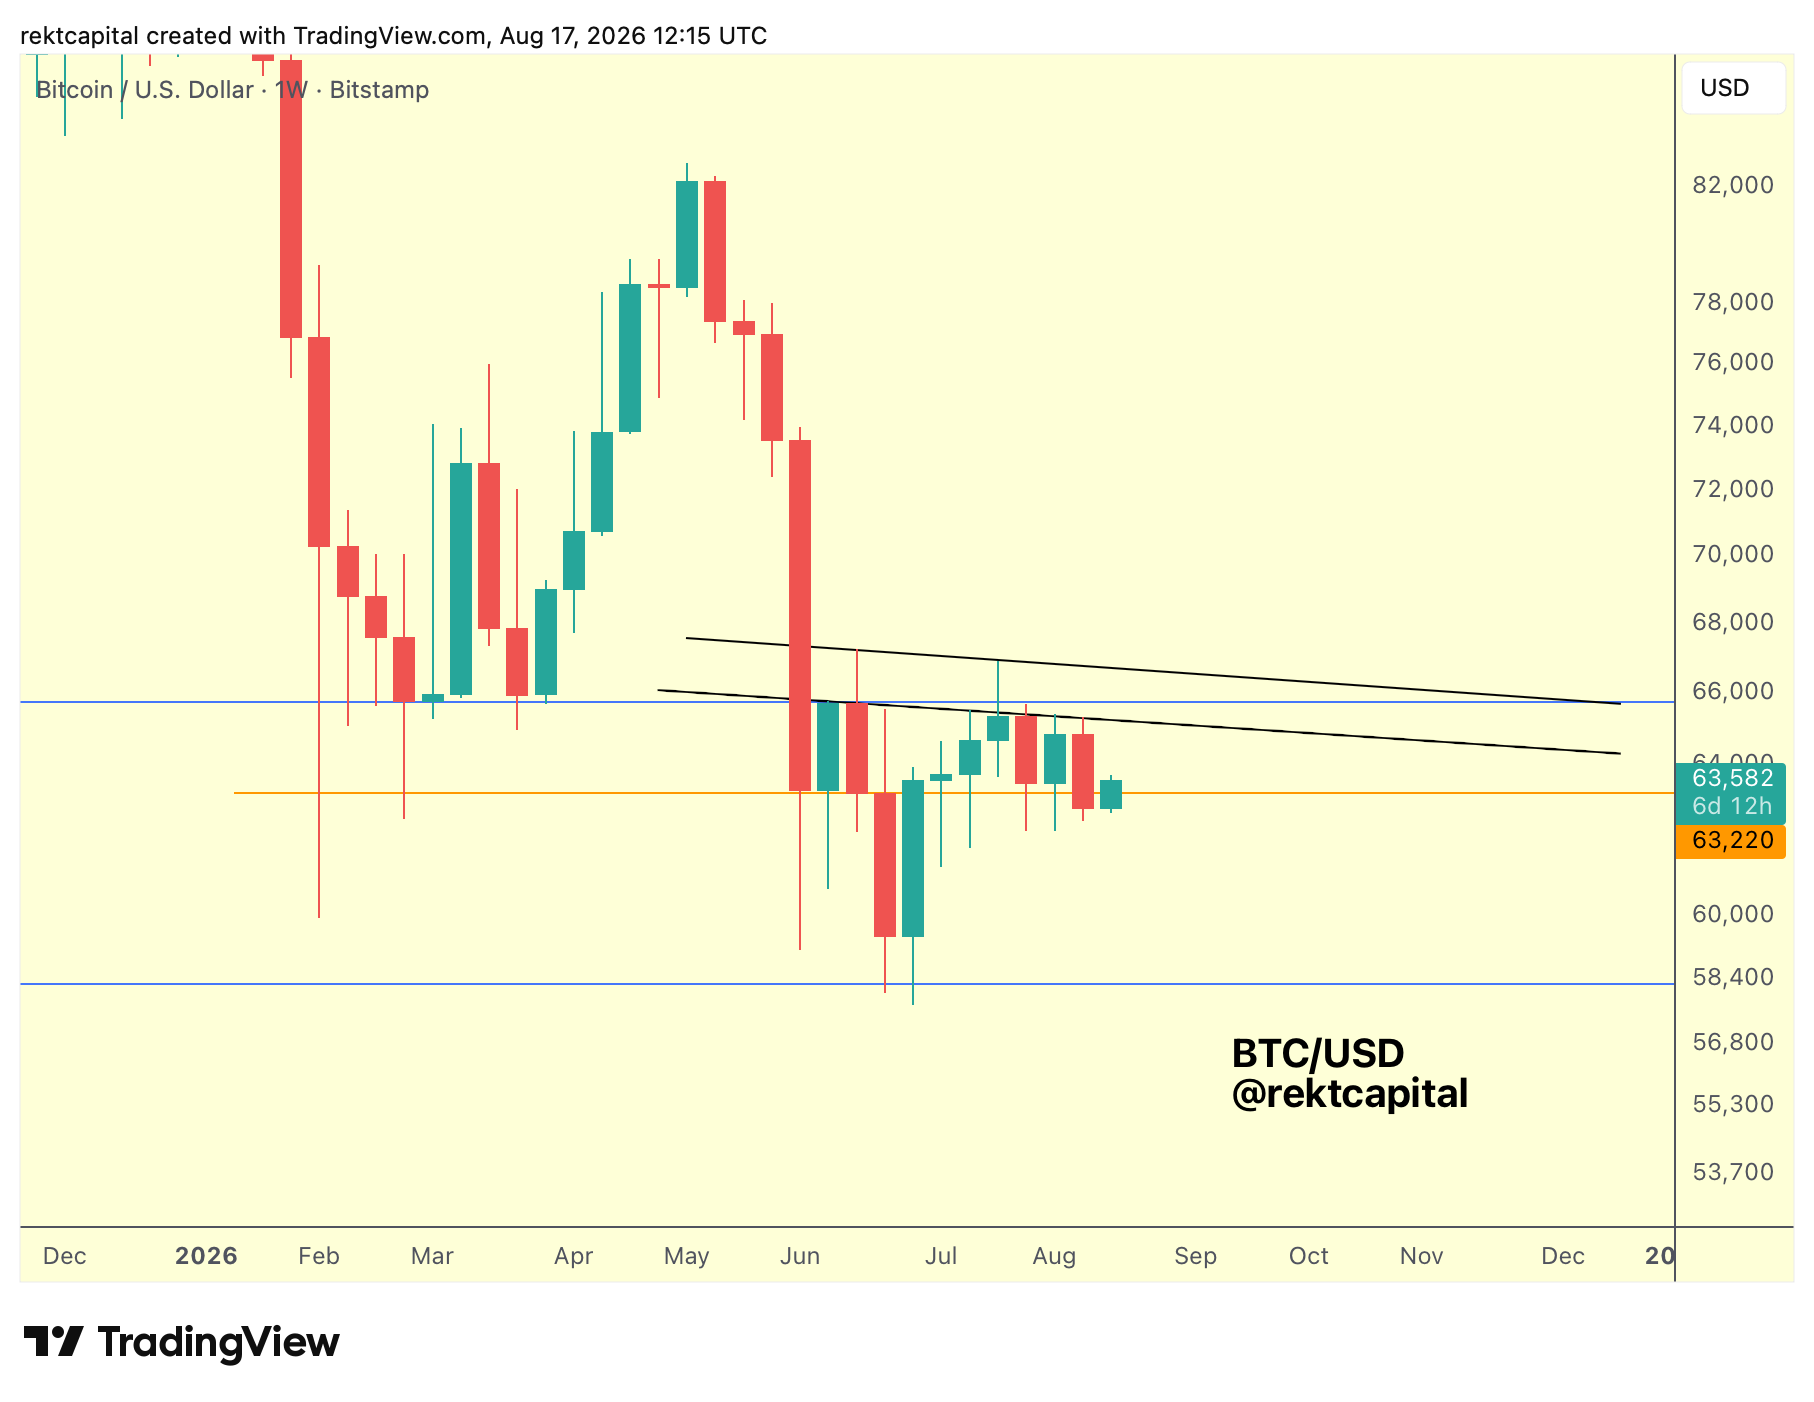
Bitcoin is still clustering in the upper portion of its blue-to-blue macro Weekly range ($58k-$66k).
That consolidation has persisted for a while now, but it's been happening at ever-increasing Lower Highs, first in the upside wicks, then in the candle bodies themselves.
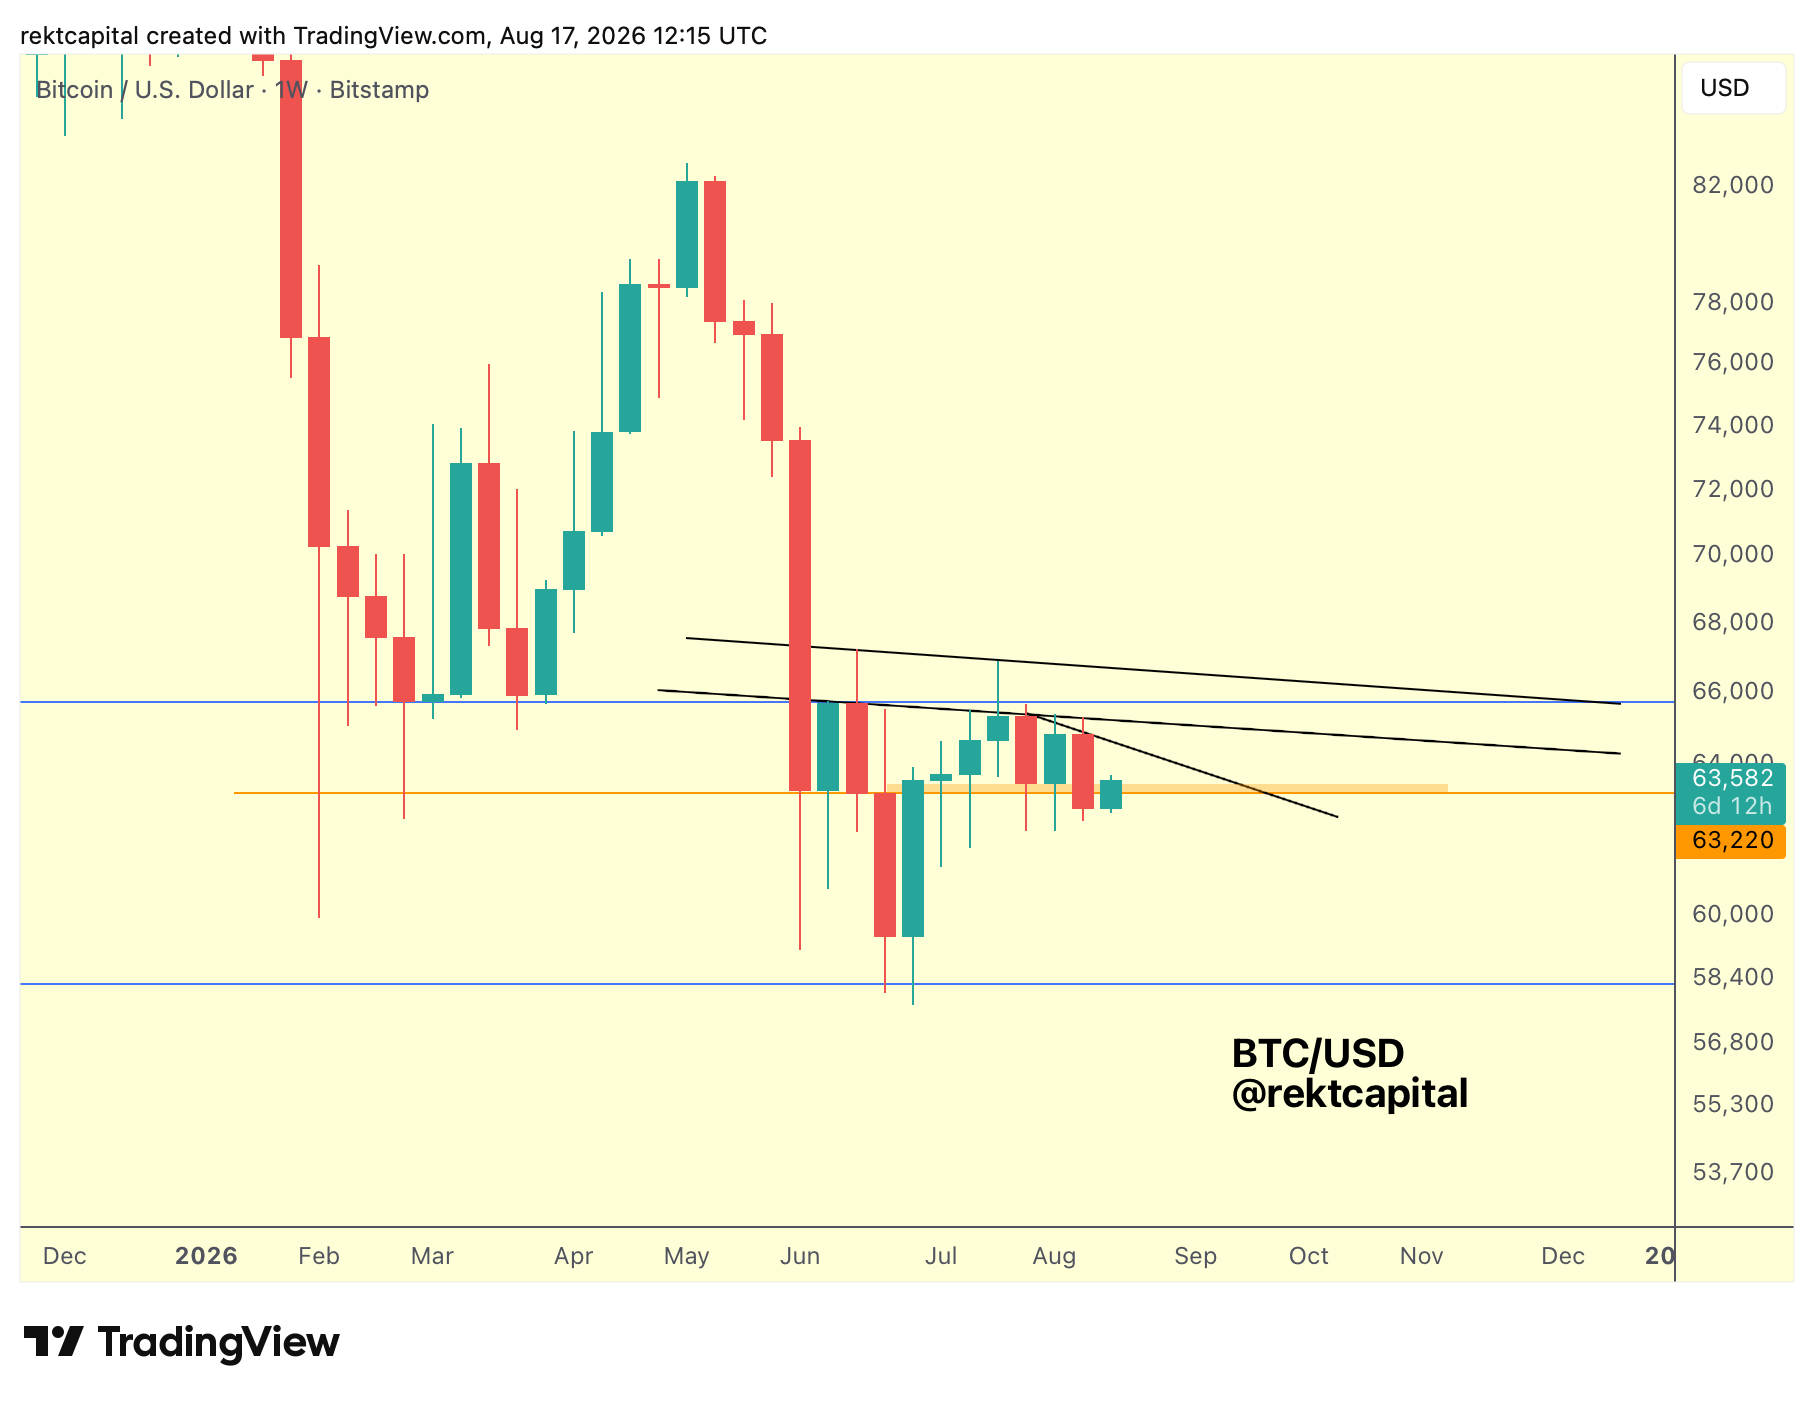
A brand-new Lower High is now developing on top of both of those, and that's mounting weakness building across two separate downtrends.
Whenever downtrends progressively stack like this, it typically signals more sell-side pressure taking hold at lower and lower prices.
The $63,000 region (orange horizontal) sits right at the centre of that pressure.
This was once support, and it briefly re-accumulated to generate that second Lower High earlier this Summer.
But rebounds from the orange area have kept getting weaker, to the point where price has now Weekly Closed beneath it.
If this region flips into resistance, that would align with the kind of seasonal weakness typically seen this time of year: a bearish retest, a rejection, and a confirmed breakdown that sends price lower into the $60,000 region.
Rebounds from $60,000 have already been weakening, so a breakdown from current levels would only add to that picture.
Context matters too.
Bitcoin's rebound off the June lows was only a 38% relief rally, from $60,000 to $82,500, and what's on show now is a far cry of that earlier move.
Set against ever-increasing Lower Highs and progressively weaker rebounds from $60000, there's a real chance that once the breakdown from the $63,000 region confirms, $60k could be in trouble of a breach itself.
And once price drops back into $60000 for another rebound, it would likely be weaker than the bounce seen since late June/ early July.
Over time, $60,000 may stop acting as a floor altogether.
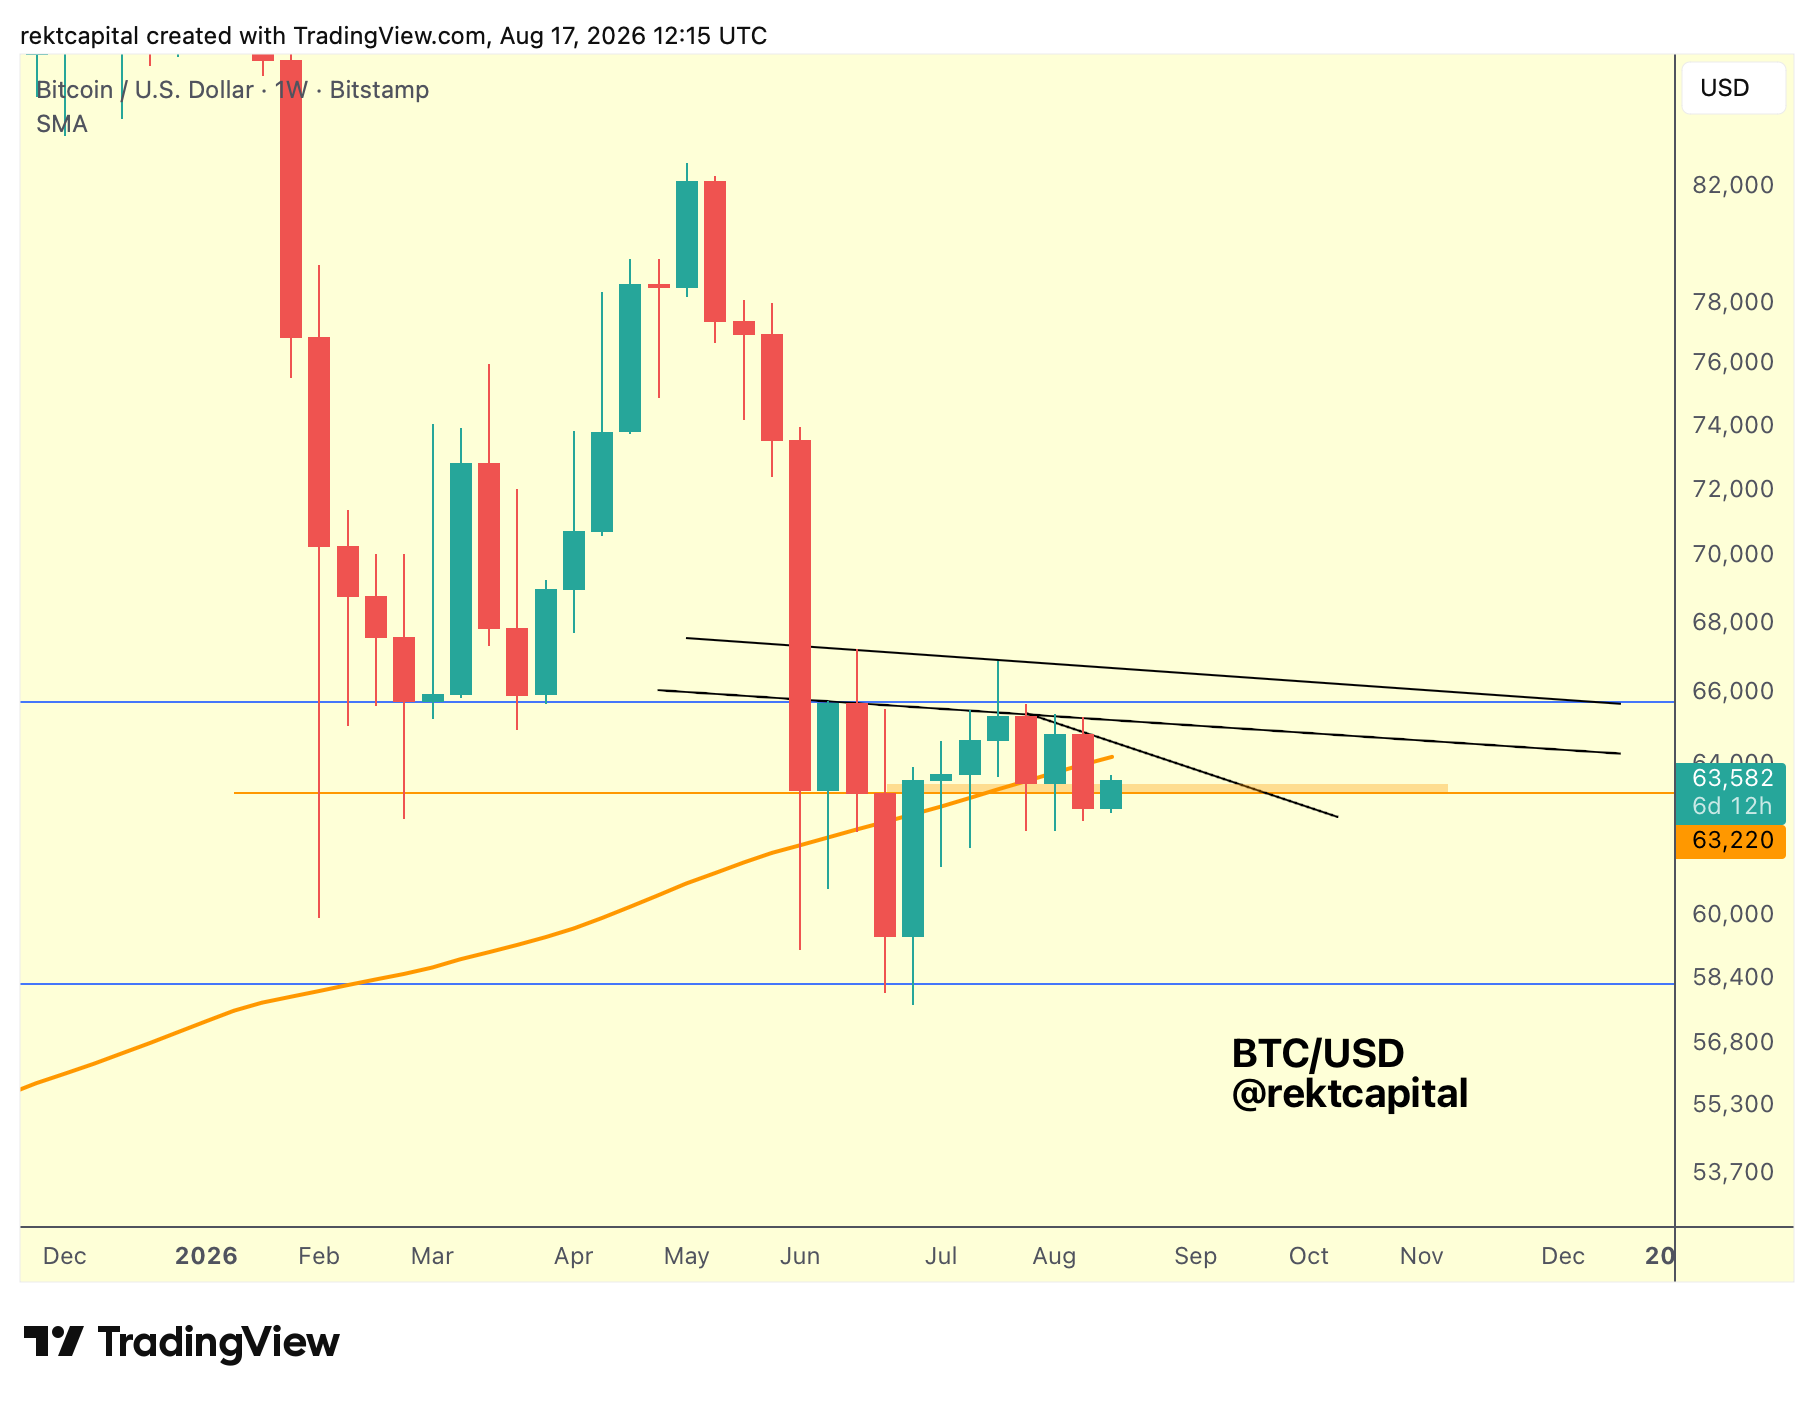
The 200-week SMA (orange diagonal) adds another layer to this.
It's historically been an unreliable level, alternating between support and resistance, but at some point it tends to flip into resistance and hold as such.
Right now it's becoming confluent with that brand-new multi-week Lower High, meaning the mounting weakness in price isn't isolated.
It's converging with a moving average that could act as a ceiling in its own right, and turning the 200-week SMA into resistance would only send price lower still.
The aggression behind Bitcoin's rebounds from the 200-week SMA has also been changing.
In past weeks, price wicked down into and below the 200-week SMA before recovering, albeit into a Lower High.
More recently however, price has Weekly Closed beneath the 200 SMA, with candle bodies now printing in and around the moving average rather than producing wicks around here.
That shift suggests the aggressive buy-side pressure that once defined this support is fading.
Levels aren't holding the way they used to, Lower Highs keep forming, and old support could be turning into new resistance.
Will the $63000 region confirm as resistance, or can buyers reclaim it before seasonal weakness sets in?
Rejection from $63k would only strengthen the historical and seasonal weakness Bitcoin typically experiences at these moments in the cycle.