Bitcoin - Calm Before The Storm?
Price compression precedes volatility
Welcome to the Rekt Capital Newsletter, a resource for investors who want to better navigate the crypto markets with the help of cutting-edge crypto research and unbiased market analysis.
Will June's Monthly Close Define the Summer?
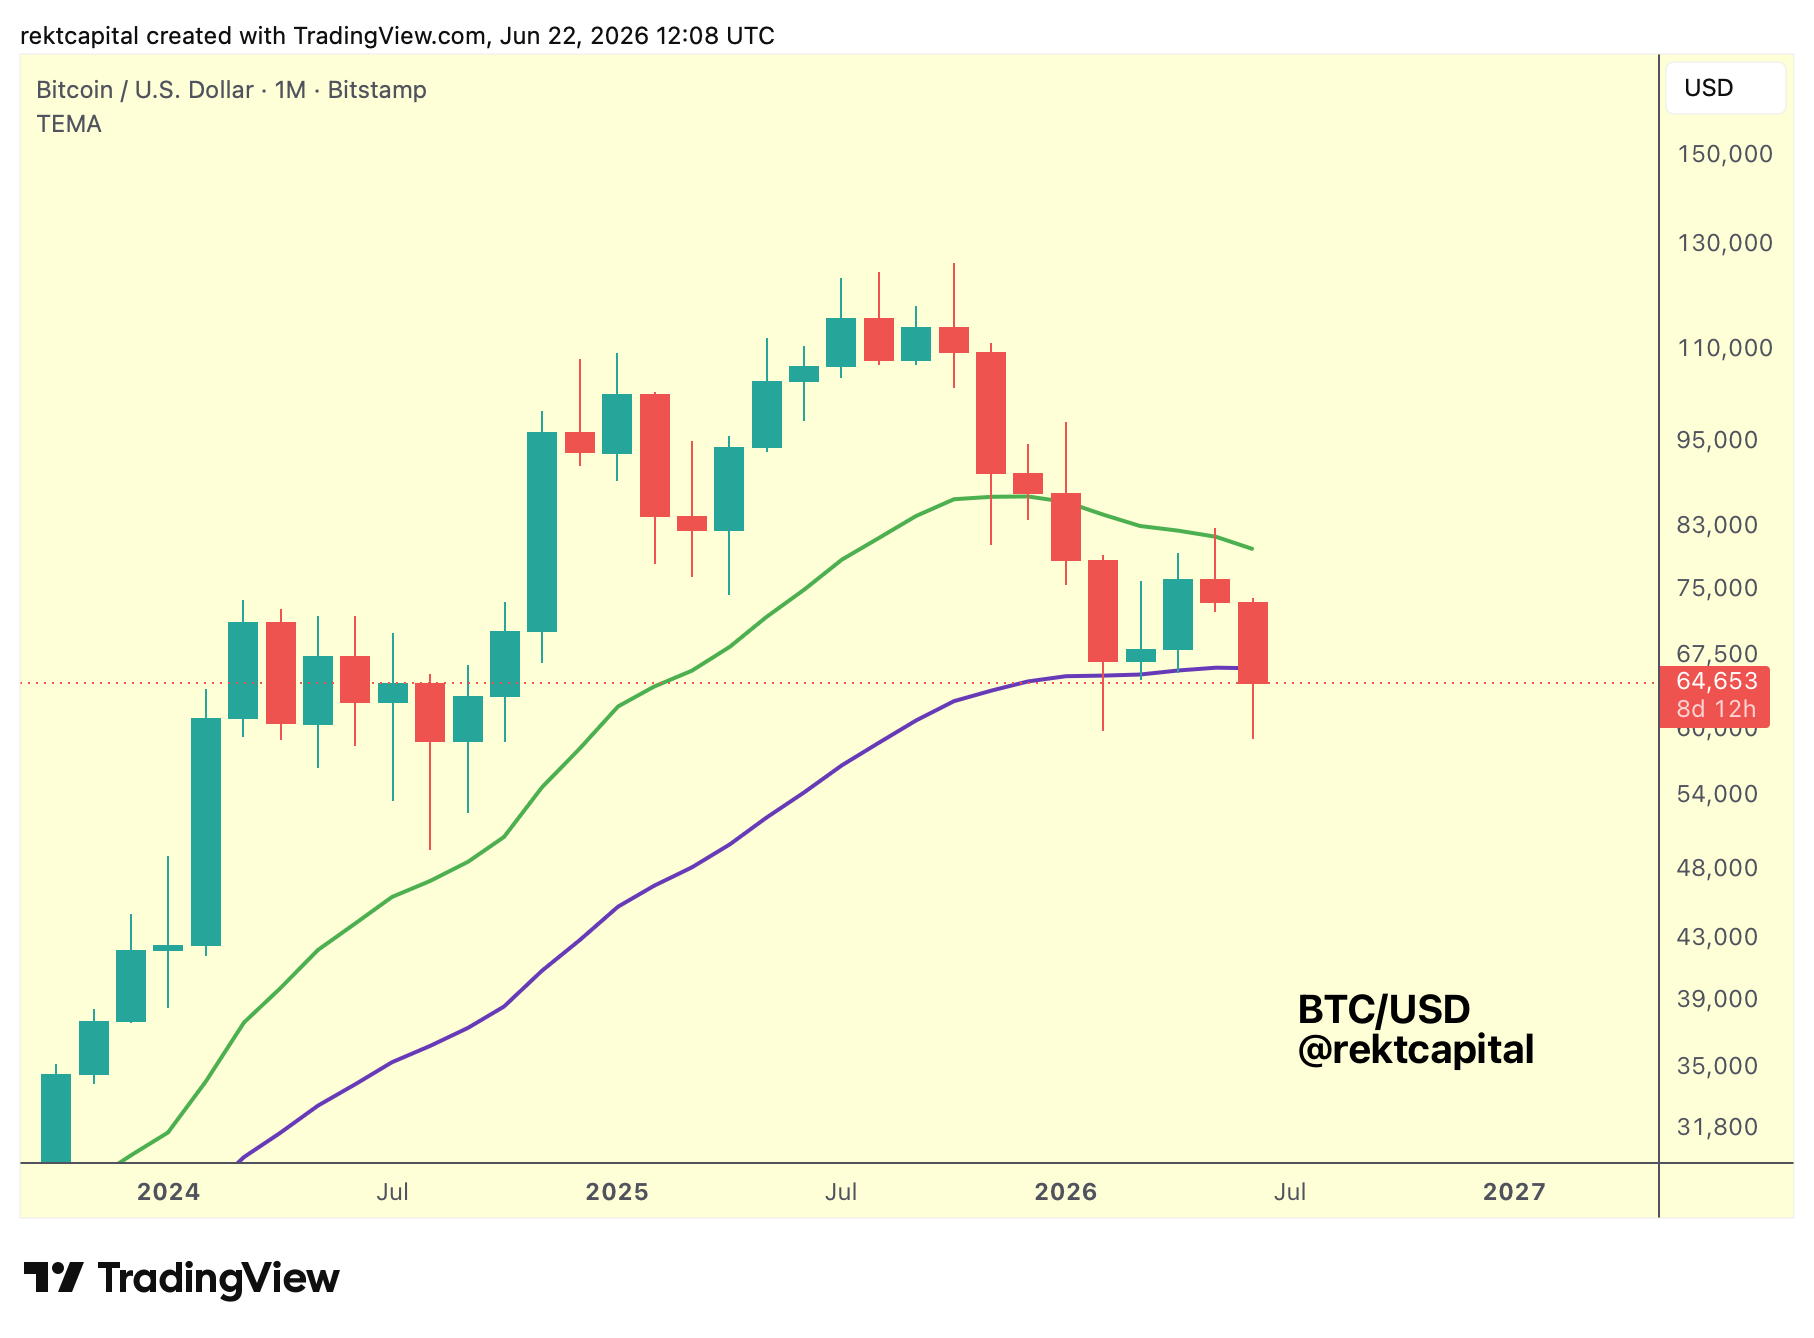
On the Monthly timeframe, the setup is simple to read:
The green 21-month EMA is sitting above price as resistance, capping the entire cluster of Monthly candles that have been building on top of the purple 50-month EMA below.
Price is sandwiched between these two moving averages, and the likely resolution is a distribution to the downside via an eventual Monthly Close beneath the 50-month EMA.
The question isn't whether that happens. It's when.
June could deliver it. So could July. So could August.
But the seasonal roadmap that tends to play out in summer months gives us a reasonable framework for how the sequence is likely to unfold.
If June closes red, July is likely to be green.
And if July is green, August is likely to cancel it out by a significant margin.
Potentially erasing a +10% July move with -10% or even more downside.
Because August tends to cancel out July and sometimes even overextend beyond whatever July produces.
So if June Monthly Closes beneath the 50-month EMA, July's green month likely exists for one purpose only: a Post-Breakdown Retest of the 50-month EMA as new resistance.
The breakdown process would be initiated in June. July handles the retest. August delivers the downside continuation.
If June instead Monthly Closes above the 50-month EMA, the scenario shifts.
Price would remain in consolidation, and July would likely produce a relief rally that generates yet another Lower High.
Two paths. One Monthly Close separates them.
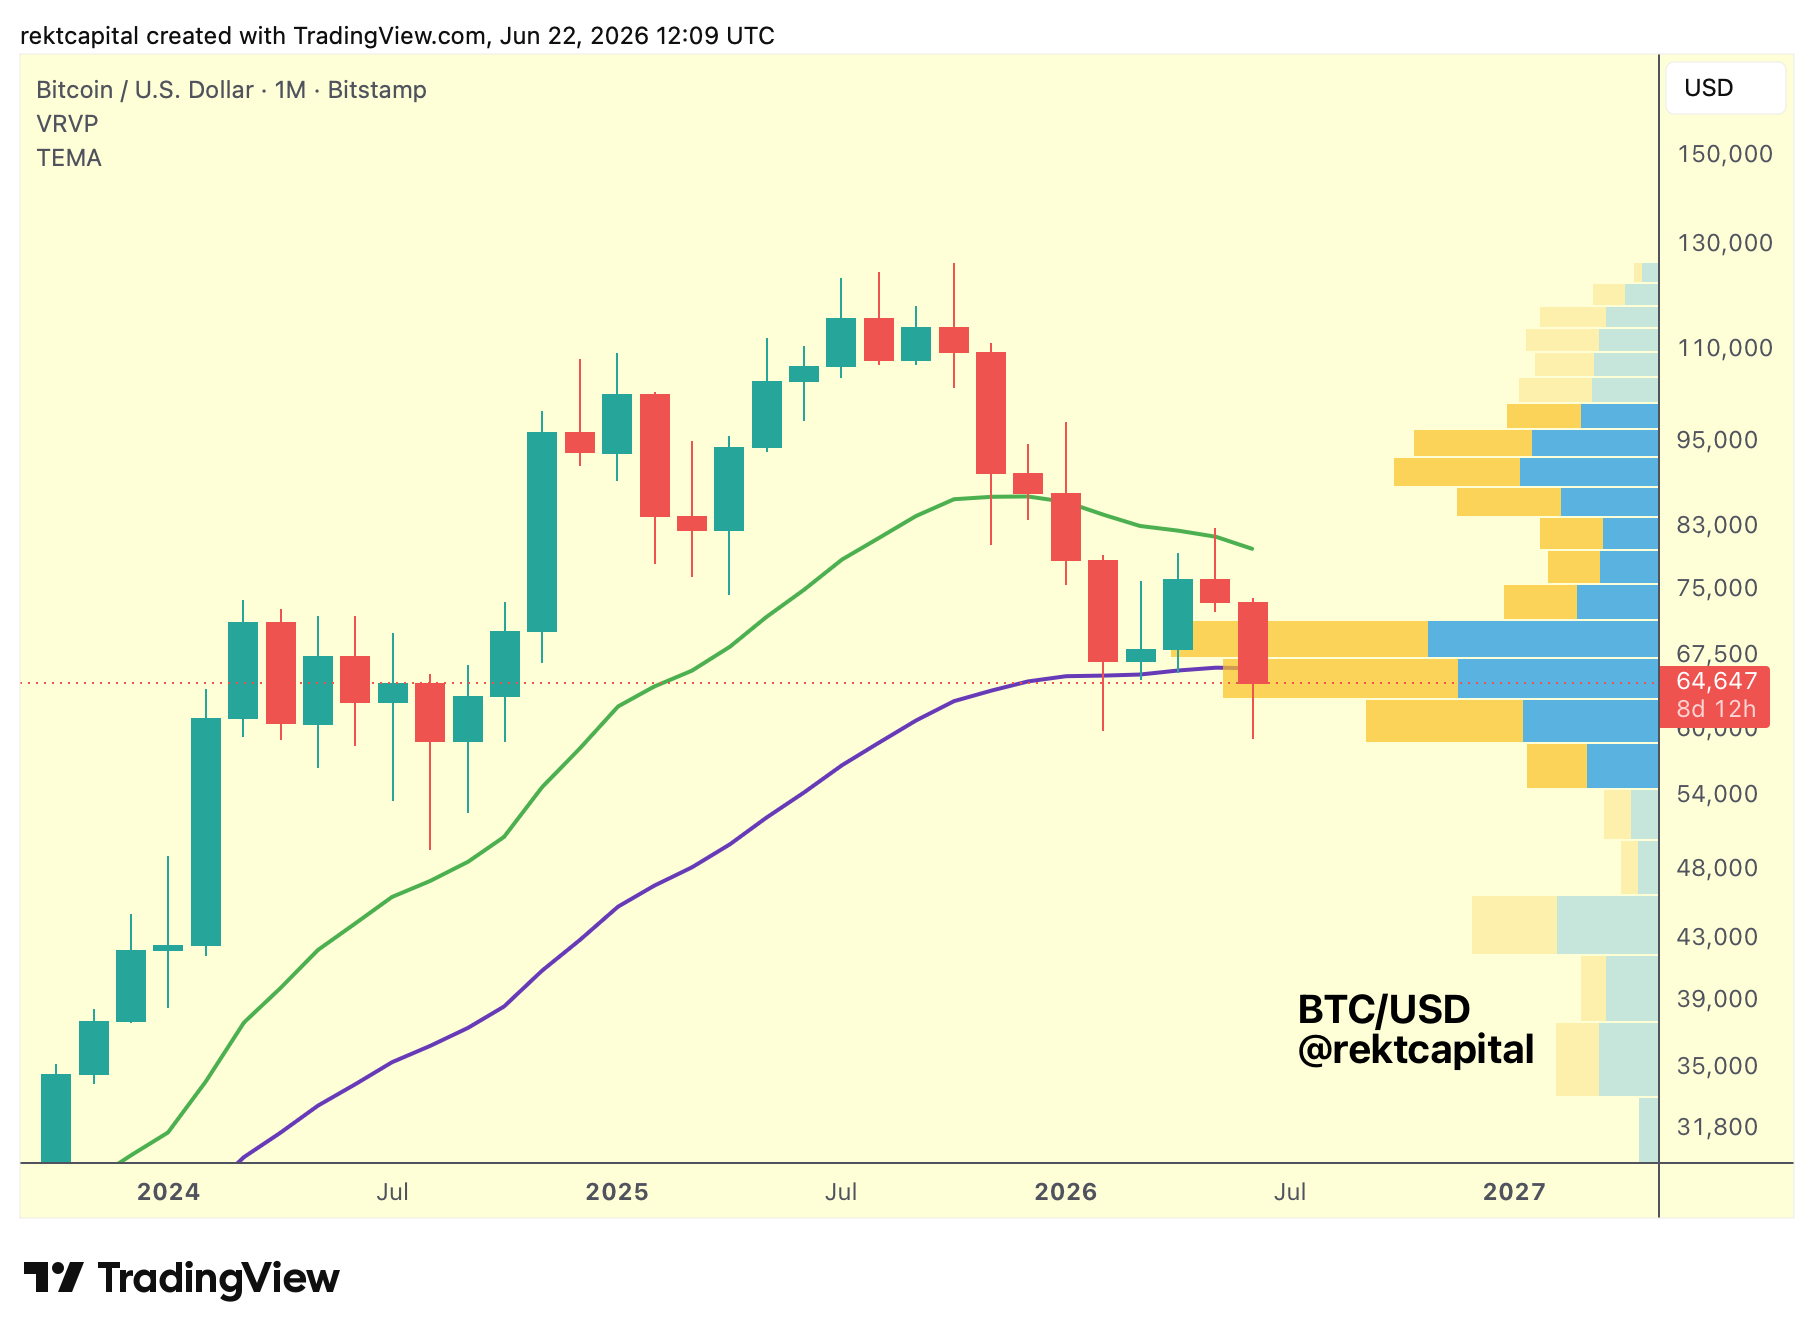
Bringing in the Volume profile adds important texture to why this region is behaving the way it is.
The current cluster around the 50-month EMA sits on a high-value node. A zone where a large volume of historical transactions has taken place.
Months of price action churning in and around these levels has built out significant volume in this area, and the volume gap that previously extended from the lows $70,000s all the way to $82,500 has already been largely filled.
The top of said Volume Gap ($82,500) is confluent with the declining green 21-month EMA. A dynamic resistance that will continue to mark Lower Highs going forward as it curves downward over time.
With that upper volume gap now fleshed out, the implication is that a new volume gap exists further below, one that hasn't been addressed yet.
If the 50-month EMA loses its role as support and begins converting into resistance, the breakdown confirmation would open a path toward the lower $50,000s, and potentially into the high $40,000s, driven by that unfilled market inefficiency below.
July turning this high-value node into new resistance would be the trigger for price to finally fill the Volume Gap that resides in the highs $40,000s and low $50,000s.