Bitcoin - Is $82500 The Ceiling Or The Breakout Point?
The confluent resistance zone
Welcome to the Rekt Capital Newsletter, a resource for investors who want to better navigate the crypto markets with the help of cutting-edge crypto research and unbiased market analysis.
$82,500 — Ceiling In The Making?
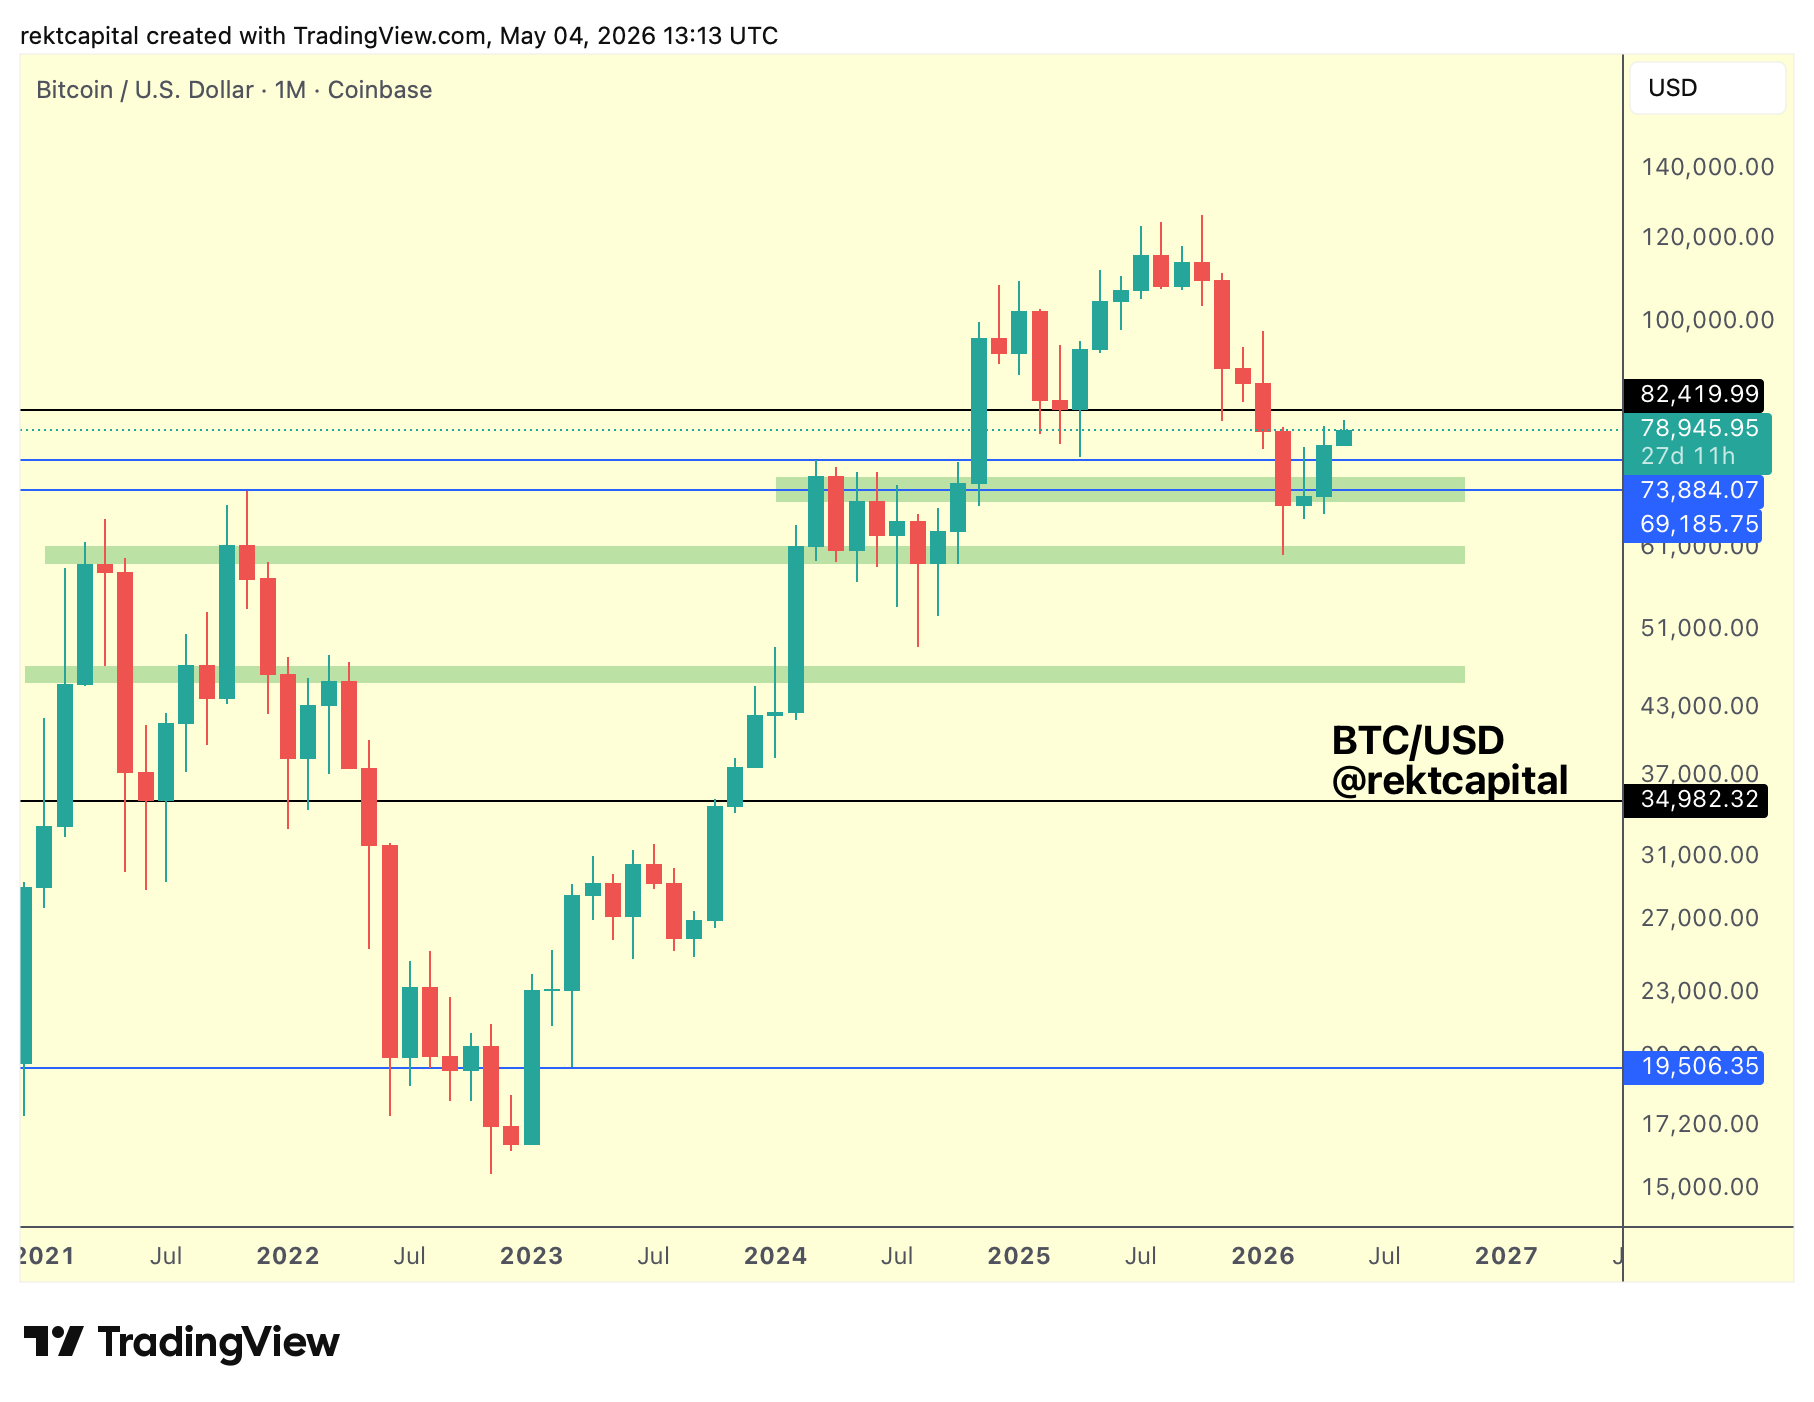
The 2021 All Time High at $69,185 (blue horizontal) and the 2024 All Time High at $73,884 (blue horizontal) are approximately confluent with the Post-Halving Re-Accumulation Range High from 2024.
This general region has had a defined role across time, and that role has switched repeatedly.
Price acted as resistance from the 2021 All Time High, then again as resistance, then turned into support, then lost it as support, treated it as resistance two months ago, and now we've broken beyond that area.
That is a region in search of a new defined role.
And there's a good chance we might be dipping back into it to try and see if we can turn it into a support once again.
The same dynamic applies to the $82,500 region.
The first time price reached it, we produced a decent rebound into new All Time Highs.
The next time price tagged the same level, we produced a much lesser rally, a sign that the support there was already weakening.
Now, $82,500 doesn't have a defined role.
But we may be defining it as we speak.
If we're rejecting from this local resistance without being able to break beyond it, that could be a ceiling worth taking seriously.
This general $82,500 region could be the ceiling that forces price into a retest of the old All Time Highs.
After all, we're just over halfway through the Bear Market, and a retest of those old highs isn't necessarily what should be happening in this moment of the cycle.
If Bitcoin isn't able to breach the low to mid-$80000s then that retest attempt of old All Time High could take place.
A Successful Retest In Need of Follow-Through
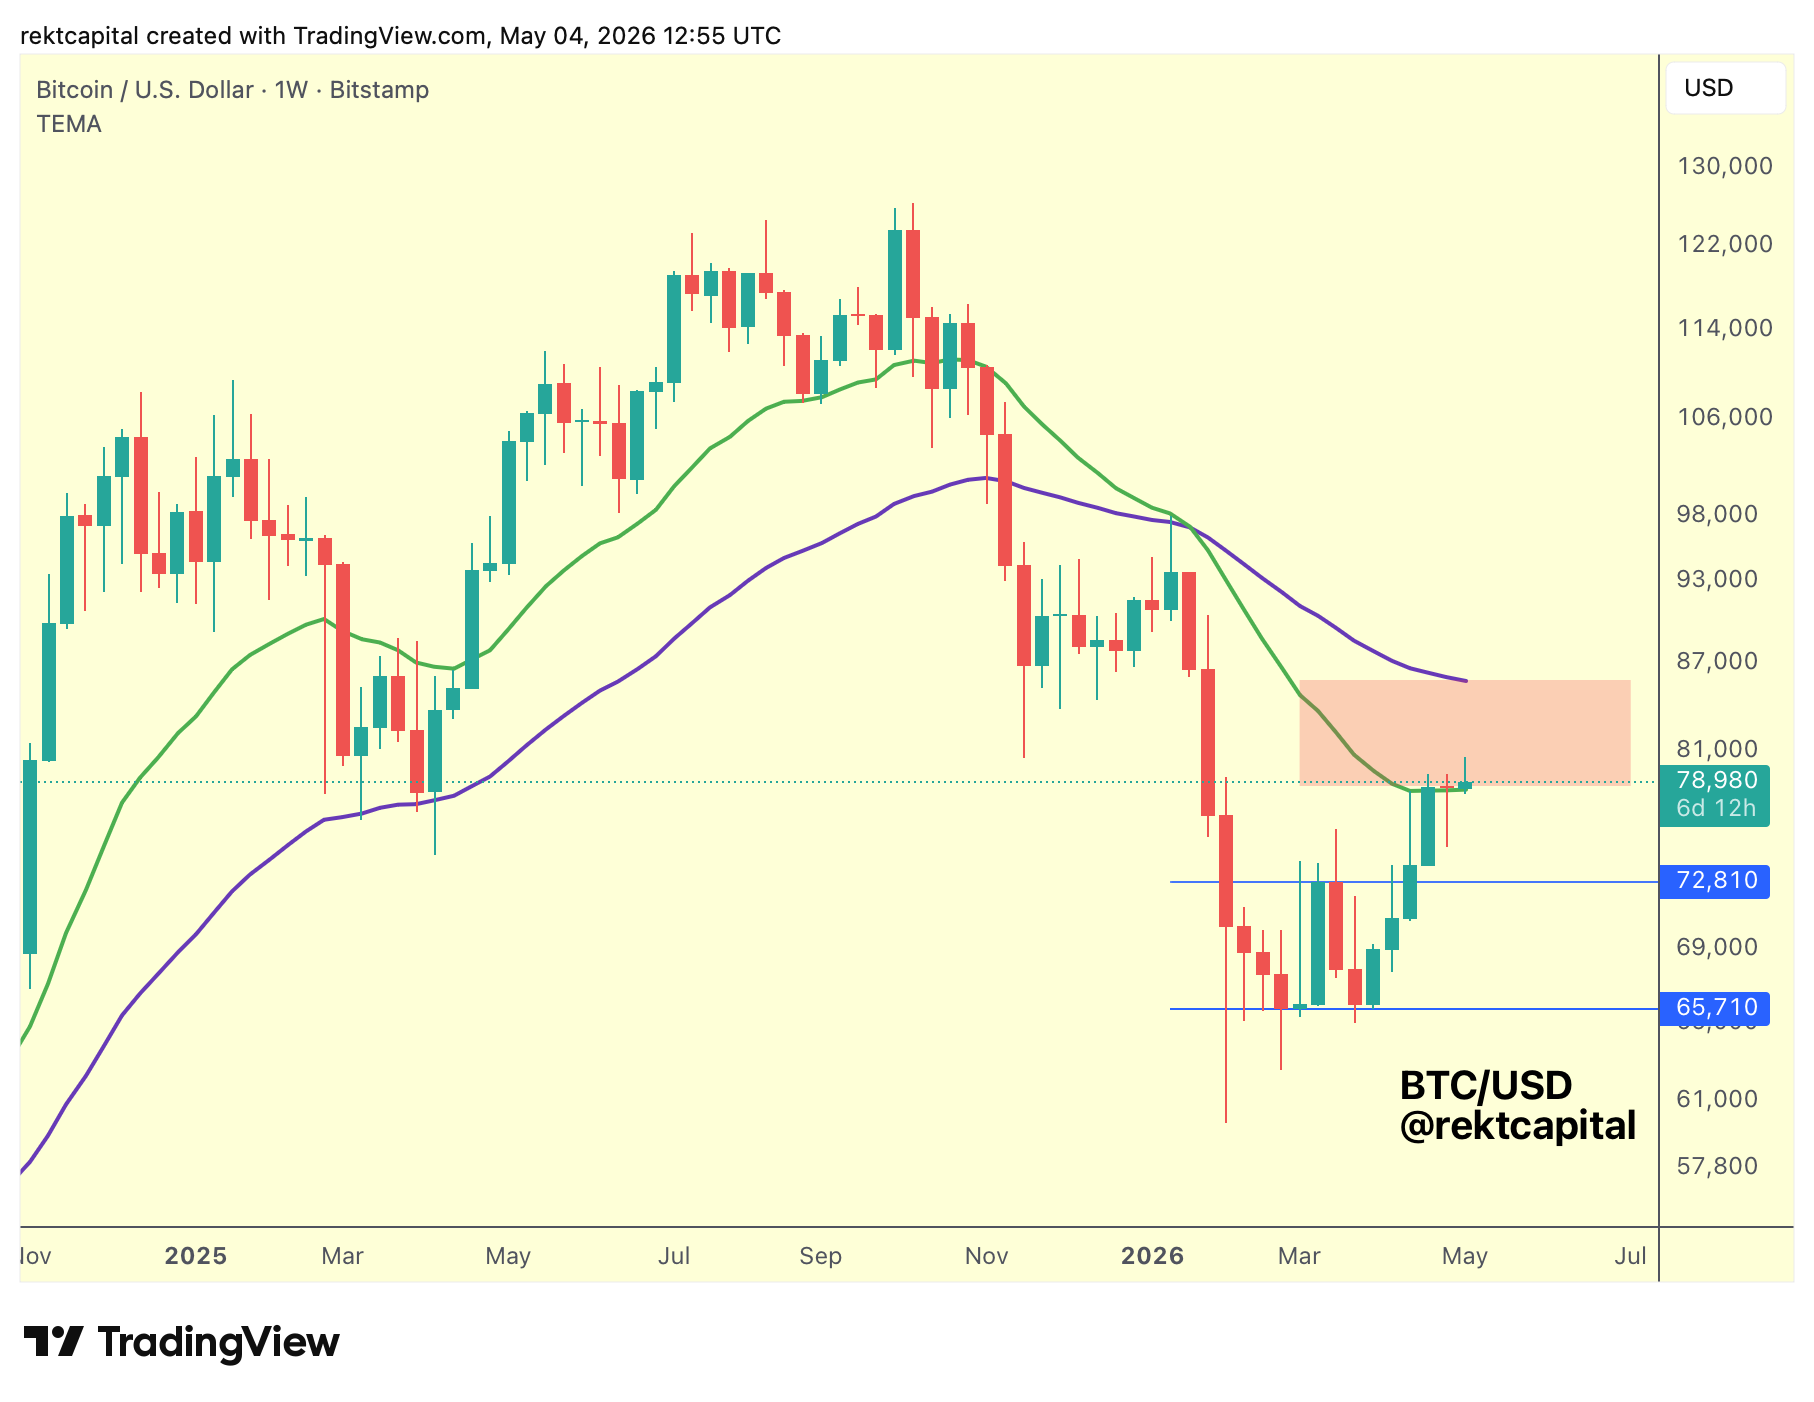
The Bull Market moving averages tend to act as support in Bull Markets and inevitably get lost as support in new Bear Markets.
What's interesting here is that we didn't really turn them into new resistance, at least not in a picture-perfect manner.
The 21-week EMA (green), when lost as support, didn't flip into a picture-perfect resistance. The 50-week EMA (purple) certainly didn't either.
However Bitcoin did eventually correct for that pre-bearish crossover of these moving averages, so they are acting as resistance.
Their divergence now outlines a general supply area.
In Bull Markets, this kind of EMA configuration typically frames a general demand area and as a demand area, you'd do pretty well treating it as accumulation, like in 2025.
As a supply area, the dynamic reverses.
This is the supply area (red box) that price is trying to contend with.
And price is trying to reclaim the 21-week EMA as a support.
BTC has Weekly Closed above the EMA, performed a very volatile retest of it, and Weekly Closed above it again. The retest is successful. The stability is there.
But we need to see continued stability in the absence of trend continuation.
There isn't any follow-through at the moment.
Bitcoin is positioned for upside. It's got the stability, it's got the price strength confirmation, turning the EMA from new resistance into new support.
But the move higher hasn't arrived.
If trend continuation does come, we'll be going deeper into the supply zone, with the 50-week EMA as the upmost stop on any upside wick.
Generally though, anything within this supply area is where price should be rejecting and failing to rally higher.