Bitcoin - Is The Top For This Rally Near?
The confluence that keeps appearing
Welcome to the Rekt Capital Newsletter, a resource for investors who want to better navigate the crypto markets with the help of cutting-edge crypto research and unbiased market analysis.
***IMPORTANT ANNOUNCEMENT***
The new home for all Rekt Capital Newsletter content is now at https://newsletter.rektcapital.co.uk and our website is now at https://rektcapital.co.uk.
Please bookmark and whitelist these two websites.
You will still receive newsletters as normal - straight into your inbox, three times a week but if you’d like to access the newsletters online please visit our new website https://newsletter.rektcapital.co.uk
Trapped Between Support and Supply
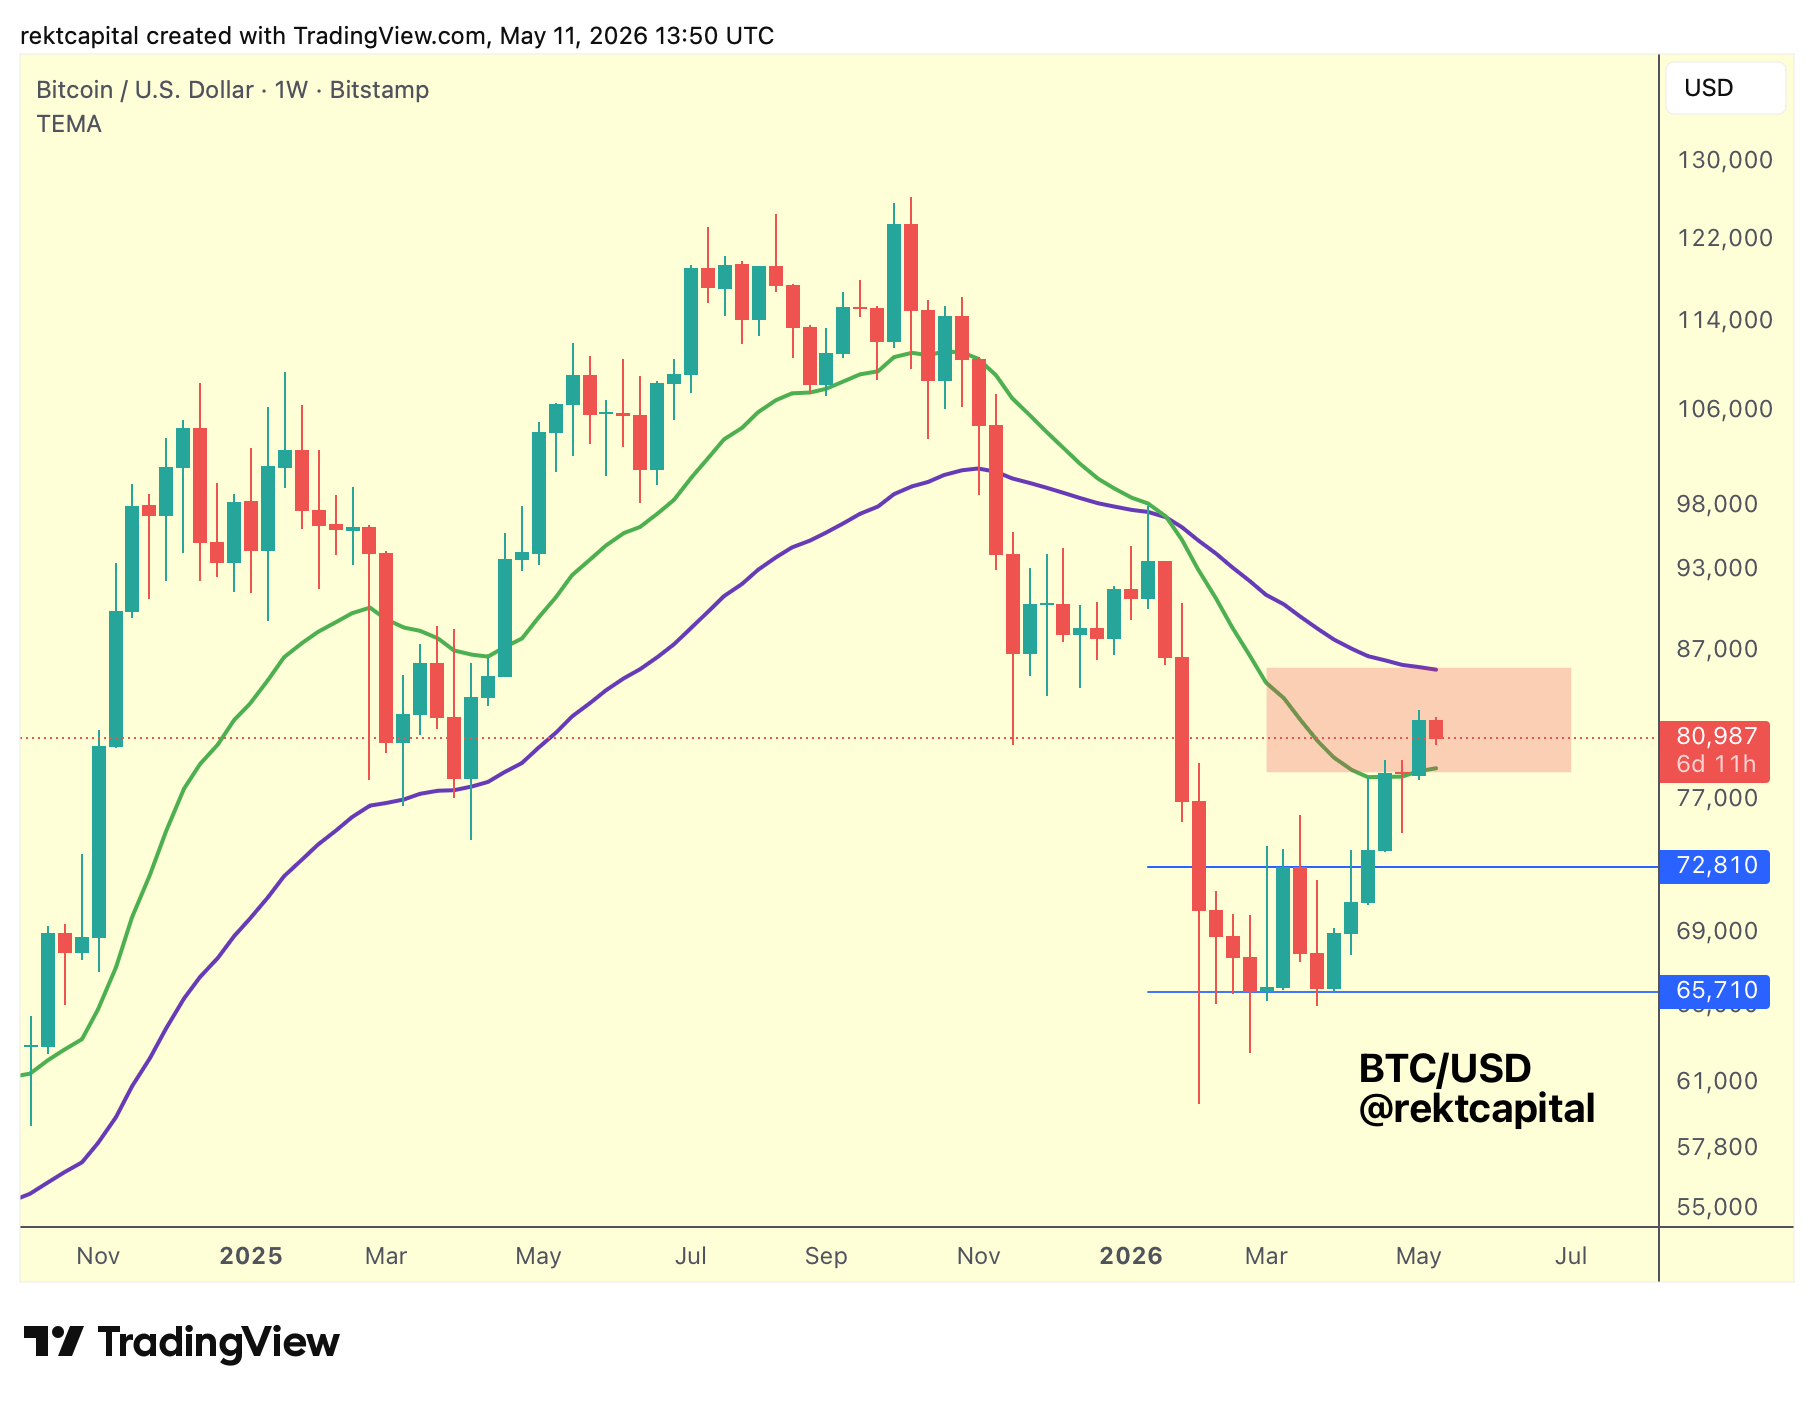
The 21-week EMA (green) is firmly established as a support.
A few weeks back, price retested it in volatile fashion, showcasing that retesting intent toward the Double Bottom formation on the Weekly timeframe.
In holding that level through three consecutive weeks of demonstrated support, Bitcoin produced the trend continuation to the upside that followed.
Now, price has Weekly Closed around the general supply area outlined by these two Bull Market EMAs, the green 21-week and the purple 50-week EMA.
That positions Bitcoin inside a vacuum between the two moving averages, where one is support and the other is resistance.
Price could technically still dip back into the 21-week EMA for yet another retest.
That would not necessarily be a negative development.
What matters is whether that level continues to hold, because only by hammering out support at the 21-week EMA can Bitcoin build the case for trend continuation toward the 50-week EMA going forward.
The structure is clear.
Support is beneath. Resistance is above.
What remains to be seen is whether Bitcoin can resolve this vacuum with conviction or whether it needs another volatile dip into the green EMA before finding enough strength to press higher.
$82,500: The CME Gap's Defining Ceiling
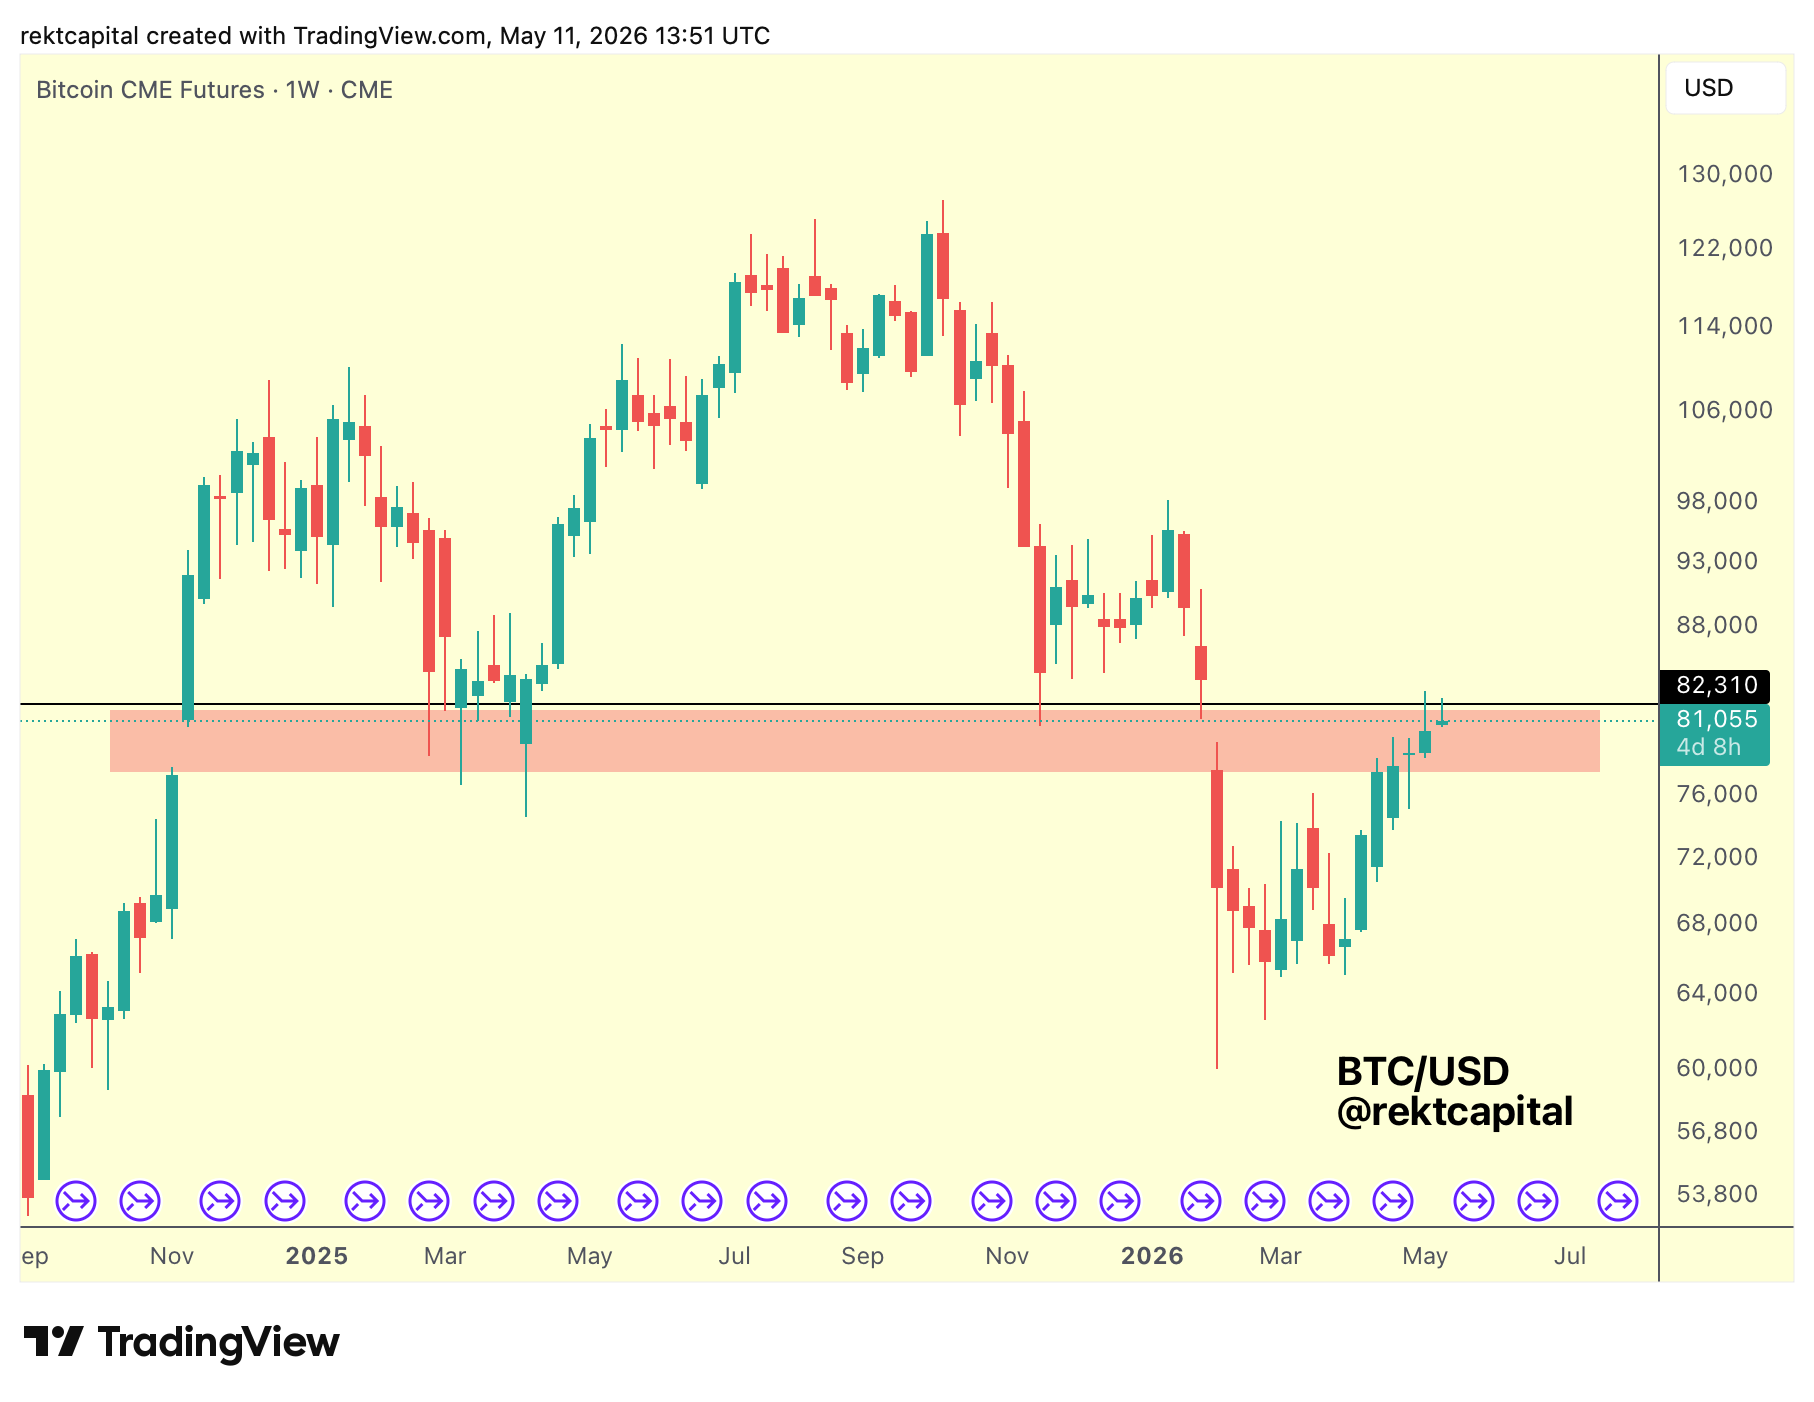
A key part of enabling further trend continuation from here would be a Weekly Close above the very top of this CME Gap.
This CME Gap (red zone) was first opened in 2024.
It was completely filled by Q1–Q2 of 2025 and then, during the pullback period, price reopened it. That second fill has now also been completed.
As a dynamic support or resistance, this CME Gap is likely to be the home for price for the time being.
A period of consolidation and ranging between the top and the bottom of the gap is the probable outcome in the near term.
What makes this structure particularly interesting is the confluence at the bottom of the gap.
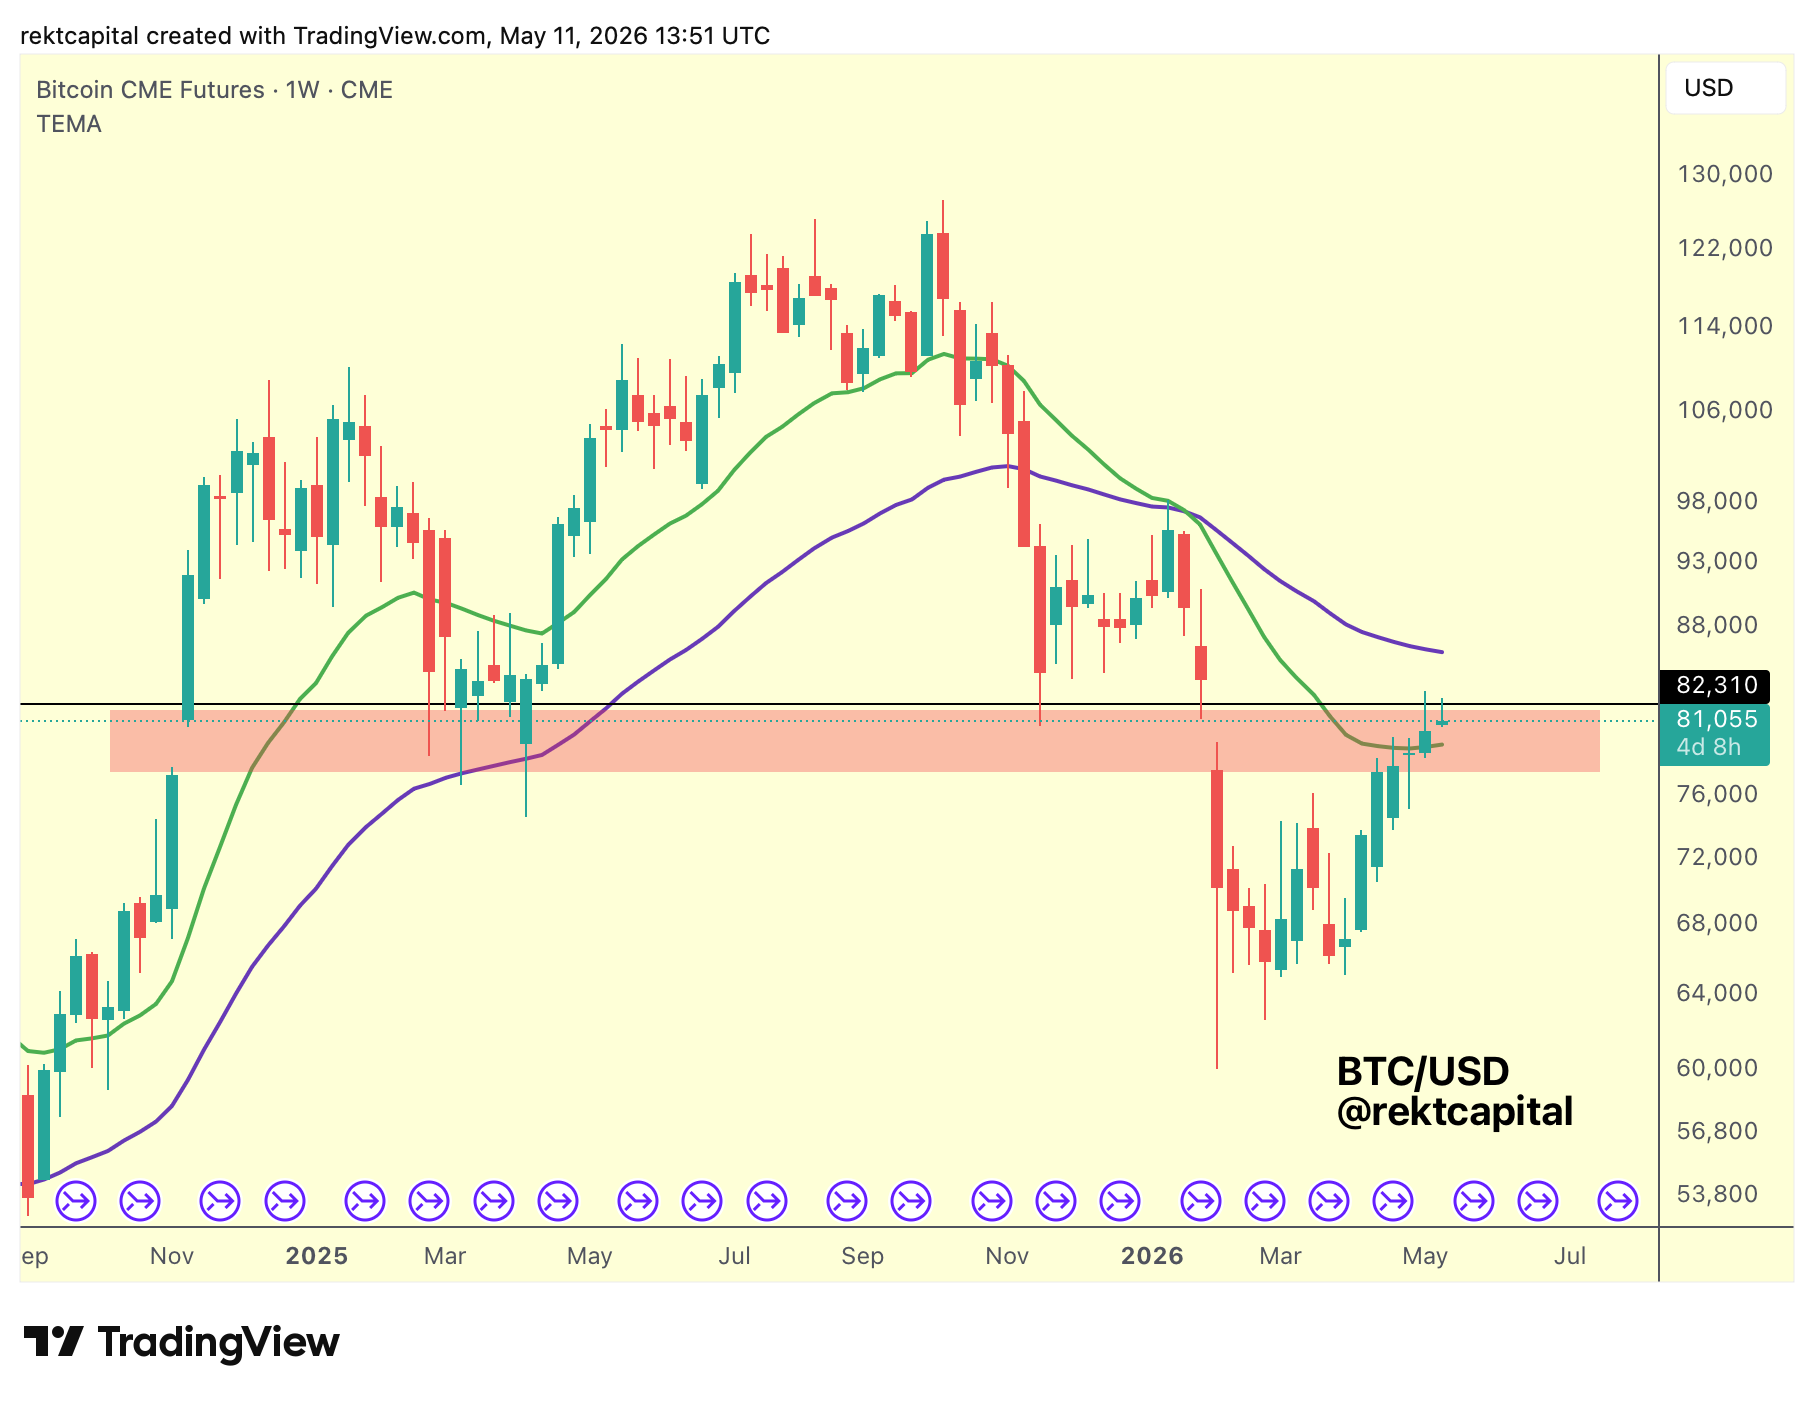
The lower boundary of the CME Gap sits in approximate confluence with the 21-week EMA (green).
The CME Gap chart suggests that a retest of that level is closer than the Bitstamp price chart implies — the Bitstamp chart requires a slightly deeper dip to reach it — but the message is consistent either way.
Any dip from current levels would find its immediate floor at the 21-week EMA, roughly aligned with the bottom of the gap.
For trend continuation to materialise, two conditions would need to be met.
That bottom boundary — the 21-week EMA and the lower edge of the CME Gap — would need to hold.
And then price would need to flip the top of the CME Gap into support.
That top is, of course $82,500 - the base of the Macro Triangle that we've spoken about for the past few months.