Bitcoin - On The Cusp Of Losing The 50 EMA?
Could Bitcoin enter Bearish Acceleration in the near future?
Welcome to the Rekt Capital Newsletter, a resource for investors who want to better navigate the crypto markets with the help of cutting-edge crypto research and unbiased market analysis.
Every Cycle Ends the Same Way
The Macro Triangle framework has been the backbone of this analysis since late 2025 and it continues to deliver.
The core thesis is this: the current cycle is a compressed version of 2021.
That compression is not cosmetic. It maps the structural fractal almost beat for beat, giving us a remarkably clear playbook for what comes next.
The 2021 cycle produced a first high, a higher high, and then a Lower High before price broke down from the base of the Macro Triangle.
This cycle has followed the same sequence.
Each major high in 2021 has a corresponding high here.
The Lower High that formed at ~$82.5k in recent months is not noise. It is the fractal confirming itself, progressively weakening the structure from within.
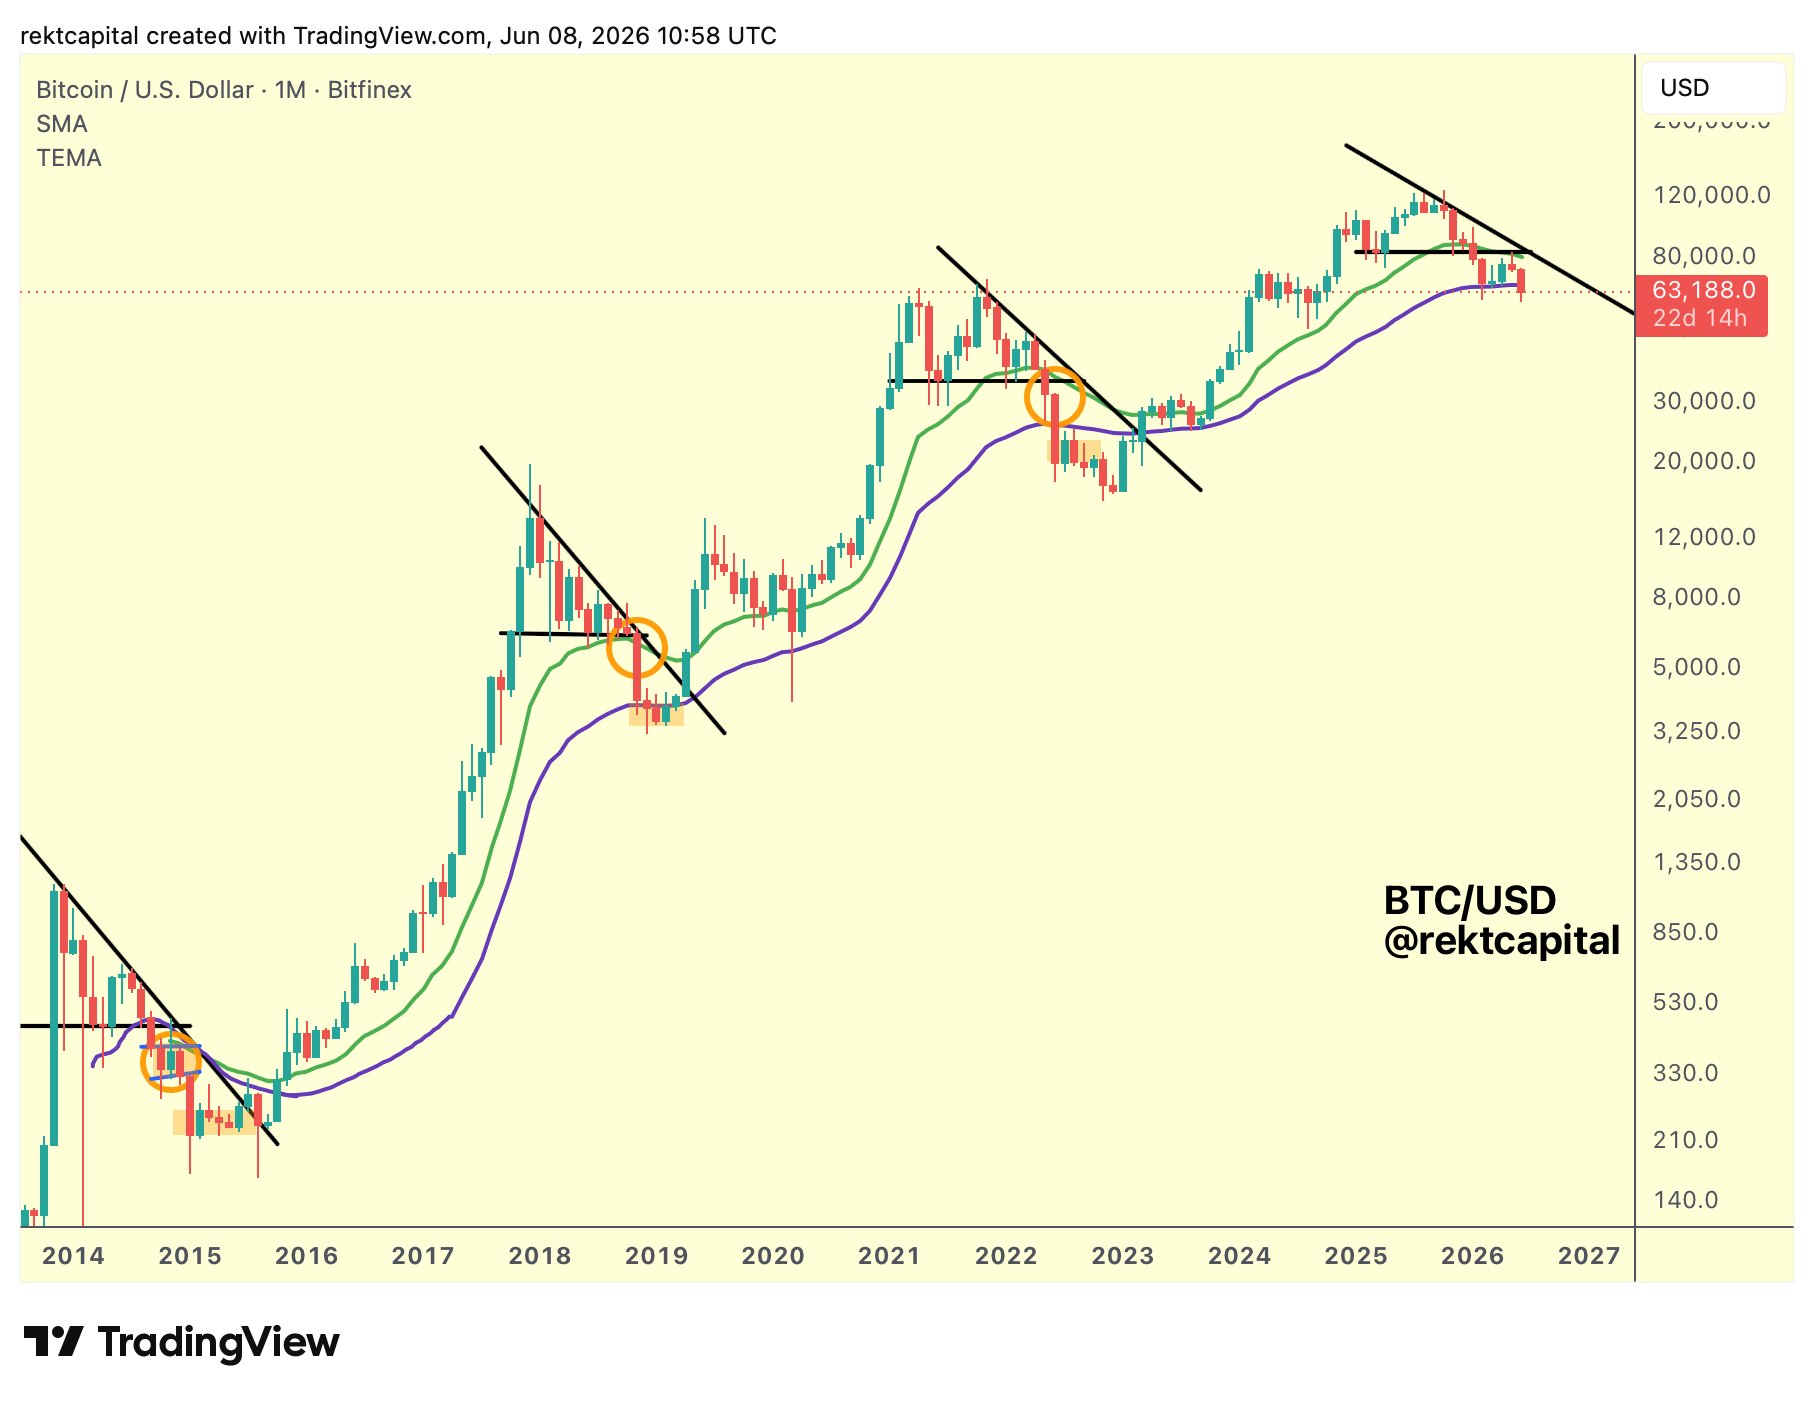
Beneath all of this sits the purple 50-Month EMA. It has been the floor. It has held, for now. But across every prior cycle, what follows from here is not in question.
In 2014, the 50-Month EMA never genuinely acted as support.
Price broke down from the Macro Triangle and the EMA was already acting as resistance by that point.
In 2018, there was a brief and shallow rebound from the 50 EMA before price eventually deviated below it.
In 2022, the pattern repeated, a rebound, and then a loss of the EMA as support. Every cycle, without exception, has ultimately seen the 50-Month EMA transition from support to resistance.
This cycle has produced a more extended rebound than any of those.
But extended does not mean different.
What the rebound has produced is a rally into the base of the Macro Triangle. Turning that level into resistance in the same way the 2014 upside wick tagged the triangle base at the equivalent moment of that cycle.
The fractal is not just rhyming. It is repeating with precision.
The orange boxes on the chart mark the multi-month sideways clusters that characterise each Bear Market phase.
In 2014, two clusters developed beneath the EMA.
In 2018, one.
In 2022, two again. One pronounced in duration, and a final three-month cluster at the Bear Market bottom.
This cycle has already completed its first multi-month cluster. At maximum, Bitcoin could produce yet another one - at least, there's certainly time for one more, at this stage.
That second cluster will almost certainly form beneath the 50-Month EMA, which means losing it as support is the necessary first step.