Bitcoin Weakness Persists - What's Next?
The Binance Hack & Mid-Terms: Seasonal Q4 Weakness Continues
Welcome to the Rekt Capital Newsletter, a resource for investors who want to better navigate the crypto markets with the help of cutting-edge crypto research and unbiased market analysis
Is Bitcoin Repeating The May Breakdown?
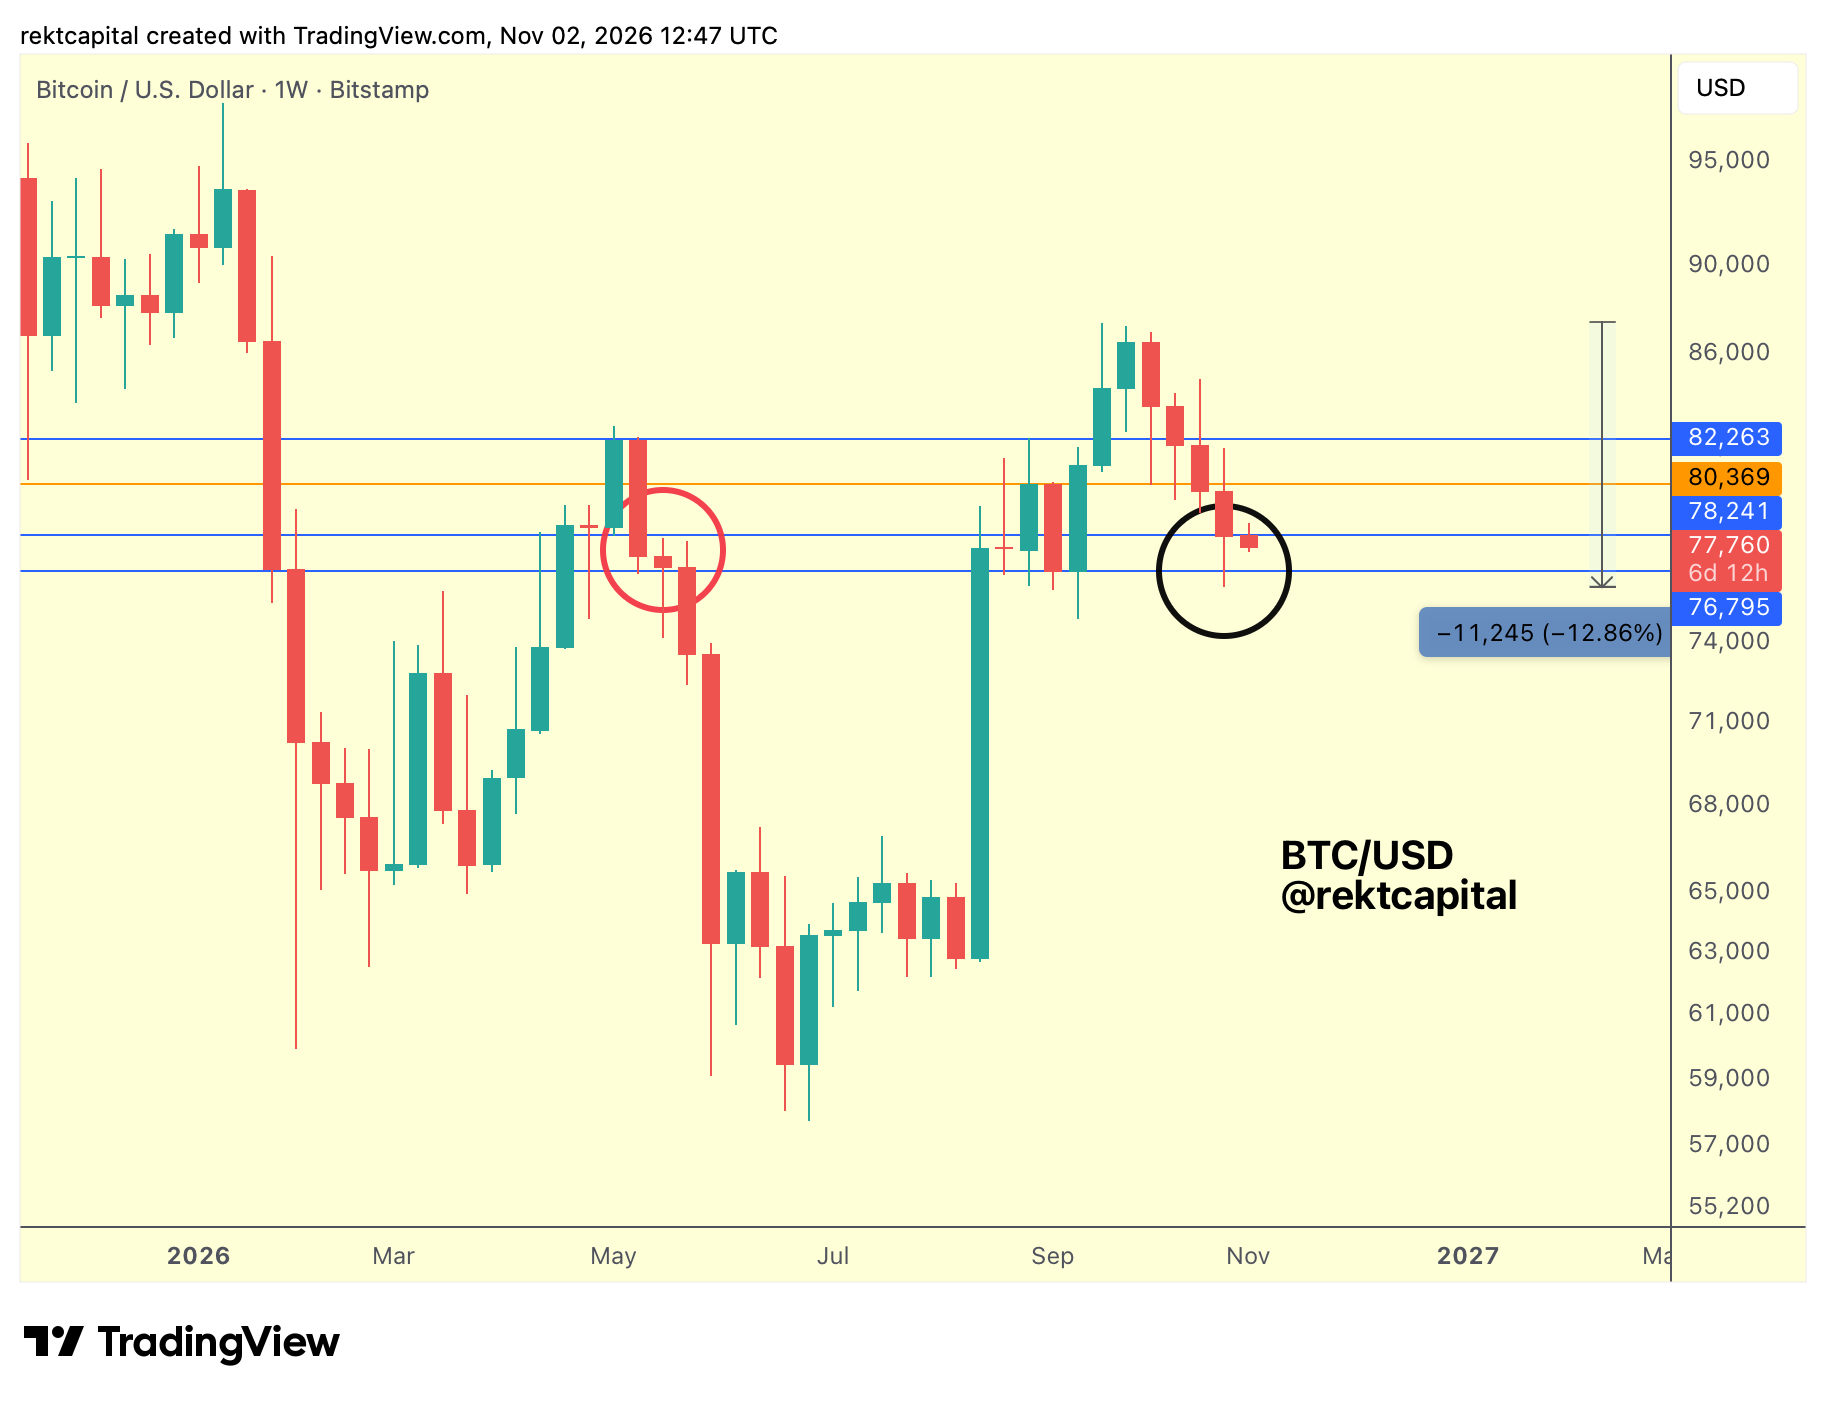
Bitcoin has Weekly Closed below $78,241 (blue), and while that close is technically only marginal, it extends a pattern that has defined price action across recent weeks.
First, Bitcoin Weekly Closed below $82,263 (top blue) and turned it into new resistance, before doing the very same thing with $80,369 (orange).
Now the same has happened at the blue level in a far more subtle manner, though price has already upside wicked into that region and is treating it as resistance.
It’s been an entire staircase of old supports turning into new resistances at every possible juncture.
Provided the blue level continues to act as resistance, Bitcoin is effectively confirming a return into the $76,795 – 78,241 range (blue-blue), with last week’s downside wick already tagging the Range Low (black circle).
And that could potentially mean some weakness at the Range Low itself.
Consider the bouncing ball analogy:
If Bitcoin only manages a lesser rally from here, this could be the ball bouncing less and less with each rebound, which could result in at least a deviation below the Weekly Range Low and at most an entire breakdown, to extend and deeper the development of the Right Shoulder after all.
Generally, whenever price rallies and then pulls back the entirety of that move, it’s never a good sign of strength, nor of the support in question being a strong region of demand.
And so it does cast a lot of doubt on the ~$76k Range Low when it comes to its strength as a support.
And what makes this latest Weekly Close particularly noteworthy is how closely it mimics the Weekly Close and bearish retest from back in May (red circle).
Back then the move was very pronounced, with a clear Weekly Close below the blue level followed by a bearish retest that flipped it into new resistance.
The result was a three-week, three-step breakdown sequence: Weekly Close, bearish retest and trend continuation to the downside.
The same steps are already unfolding here, with a Weekly Close below old support and a bearish retest turning it into new resistance as early as this Monday.
That leaves downside continuation as the final step in that process.
Bull Market EMAs Under Pressure?
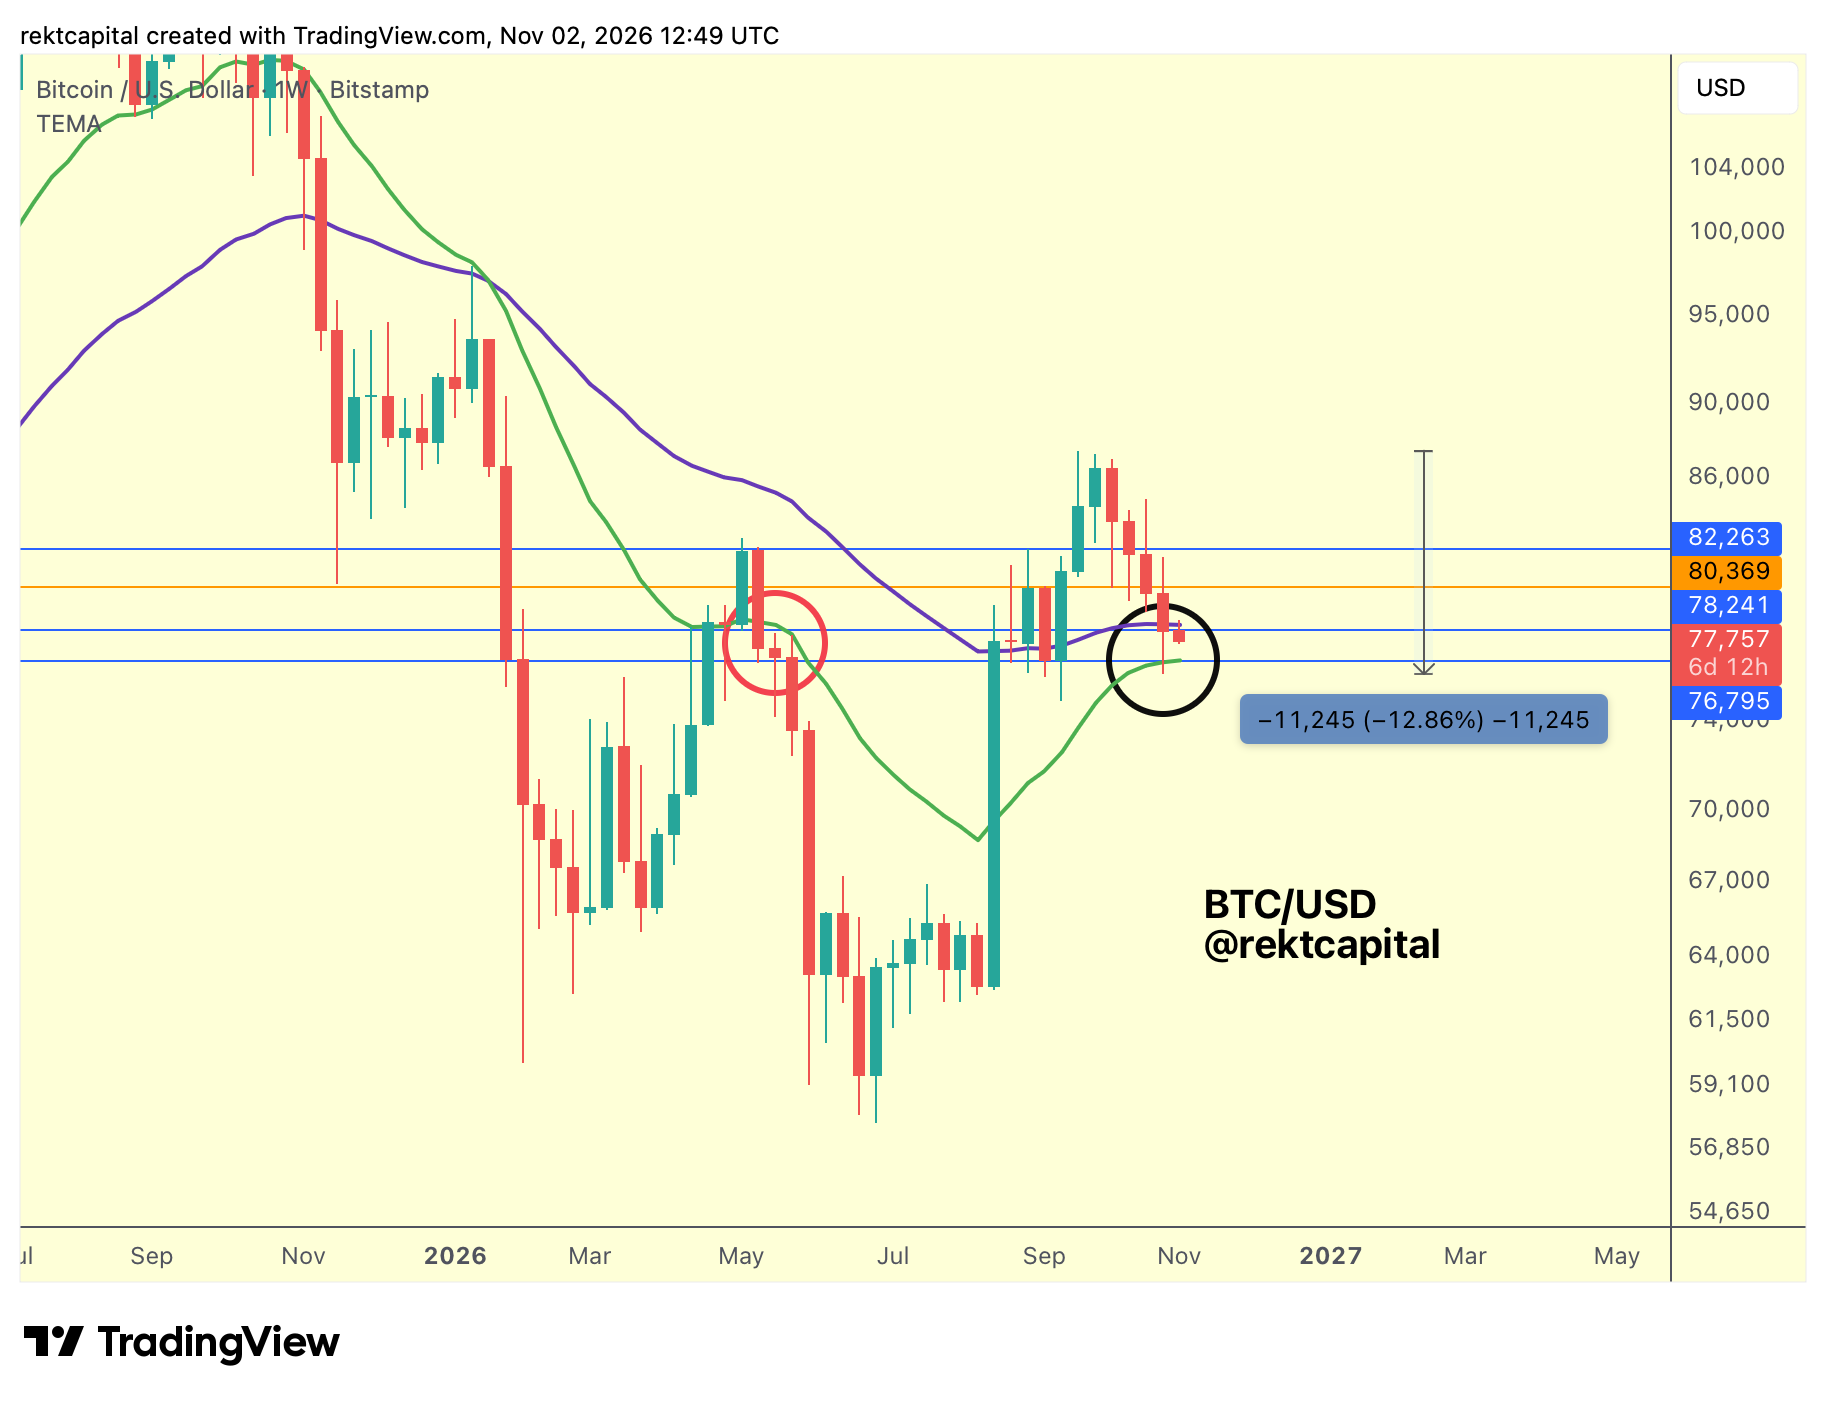
Having Weekly Closed below $78,241, Bitcoin now finds itself in an interesting position relative to the 50-week EMA (purple).
The 50-week EMA and the 21-week EMA (green) are both Bull Market EMAs, and in a Bull Market, both need to act as support.
In Bear Markets, however, these same EMAs tend to act as resistance or failed supports instead.
For now, Bitcoin has Weekly Closed below the 50-week EMA and is already turning it into resistance; interestingly this EMA is confluent with the ~$78300 Weekly level.
At the same time, price has bounced from the 21-week EMA, leaving Bitcoin inside a range of two Weekly levels and between two Weekly EMAs.
Here is my perspective on price relative to these EMAs and how to think about the potential confirmation of downside continuation below them: