Bitcoin - How To Prepare For August
Dissecting the Summer Range and its historical analogues
Welcome to the Rekt Capital Newsletter, a resource for investors who want to better navigate the crypto markets with the help of cutting-edge crypto research and unbiased market analysis.
Can Bitcoin Break This Ceiling?
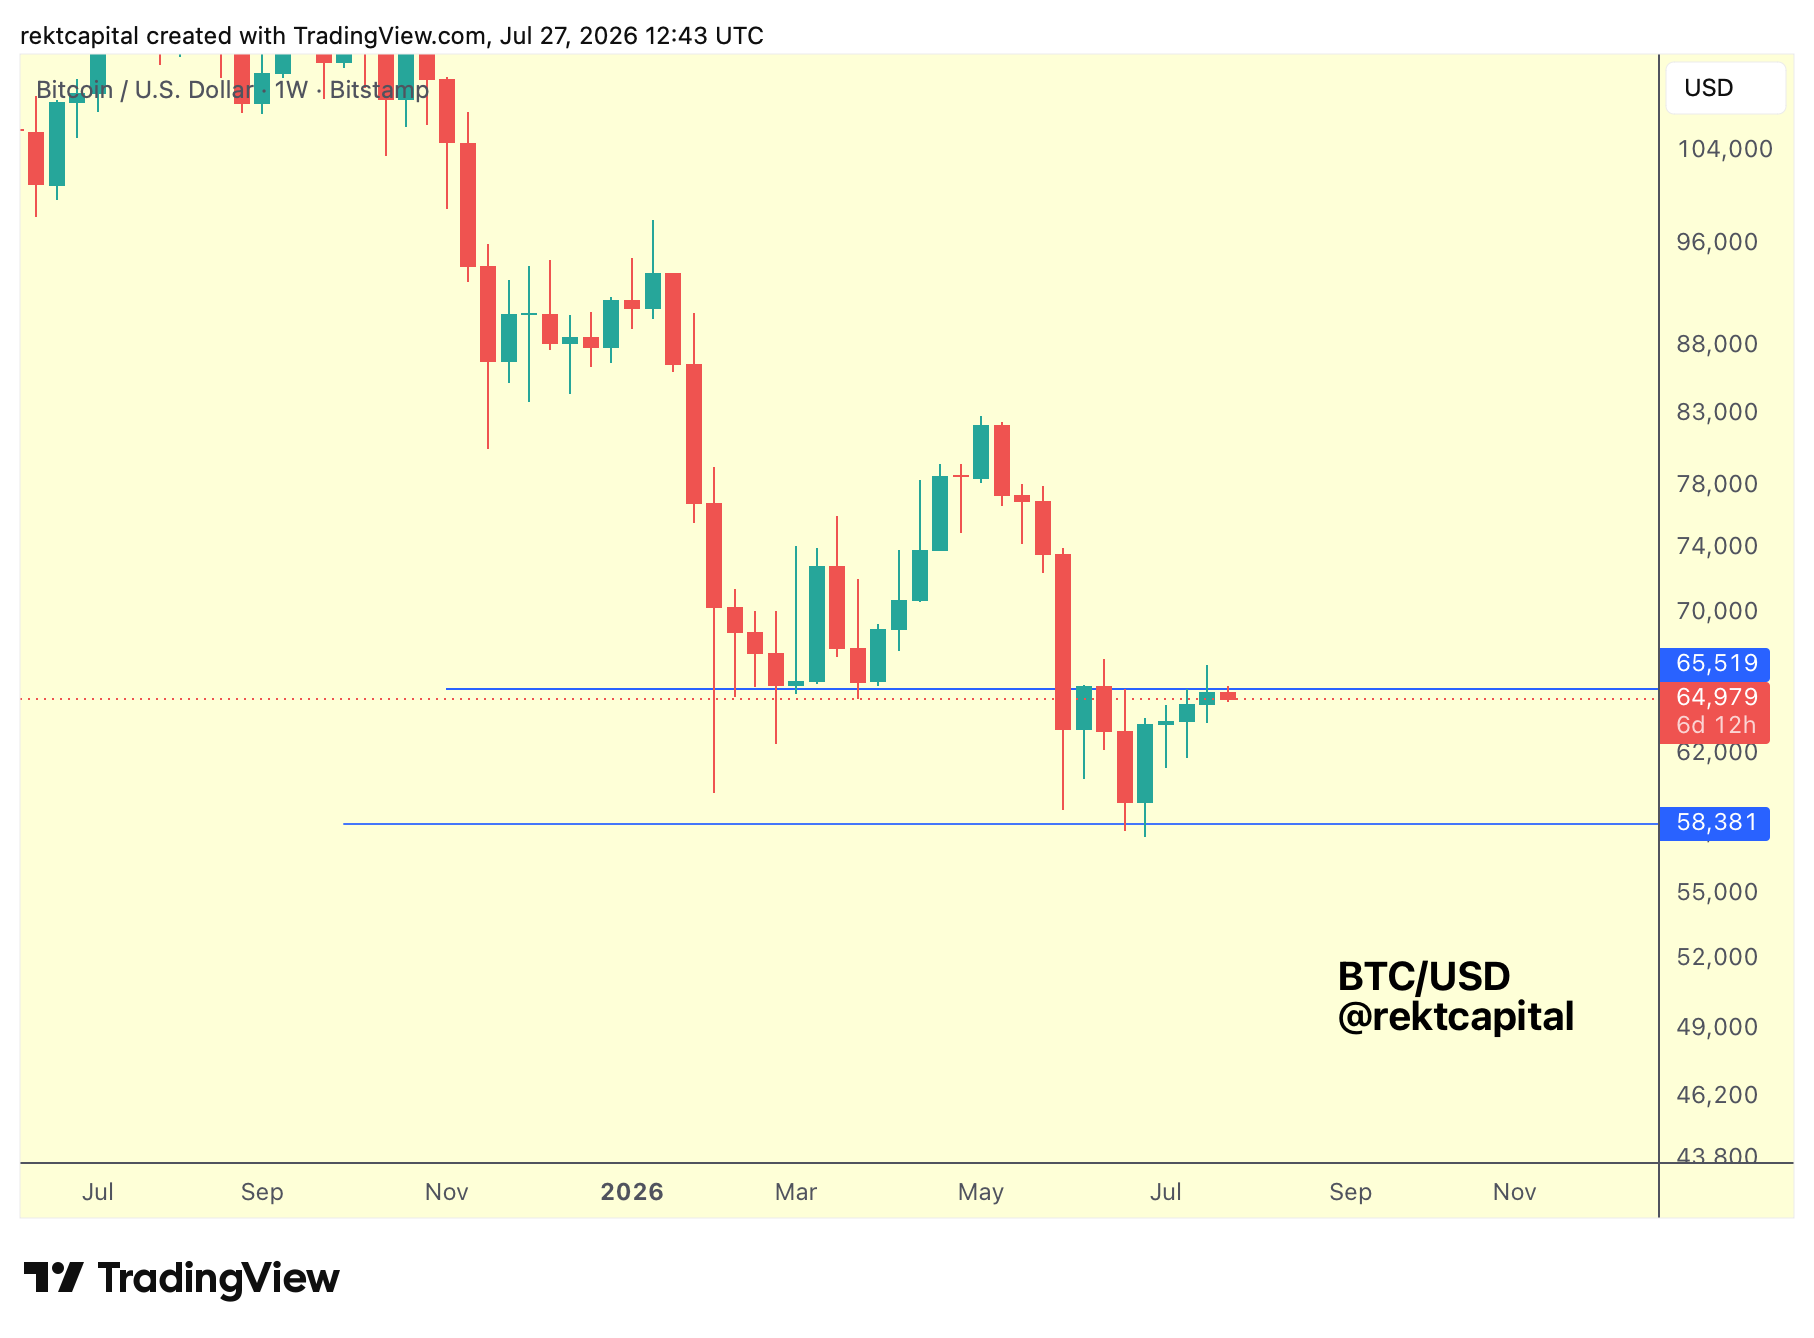
Bitcoin remains range-bound between $58,381 (blue) and $65,519 (blue), building out this cluster for a good few months now.
That range sits beneath a much larger multi-month cluster running from January through March 2026, above the $65,000 region, and this cluster is effectively becoming a major zone of potential supply.
When price broke down below $65500 in pretty much one Weekly candle body, there was no demand willing to step in and defend the downside.
What was once a historically transacted demand zone throughout February-March has since flipped into supply.
More specifically, resistance is honing in around $66,000, home to the 50-month EMA.
This region of prior support is now acting, and continuing to act, as an area of supply.
We've now closed below $65,519 on the Weekly for a third consecutive week just beneath resistance.
Price has been hanging about just beneath these highs for a few weeks running, failing and struggling to breach the level each time.
We're still Weekly Closing below here so there's no real crystallisation of a shift in trend just yet.
For now, this level continues to behave exactly as it has for weeks: a ceiling, not a springboard.
Bitcoin's Volume Still Isn't Showing Up
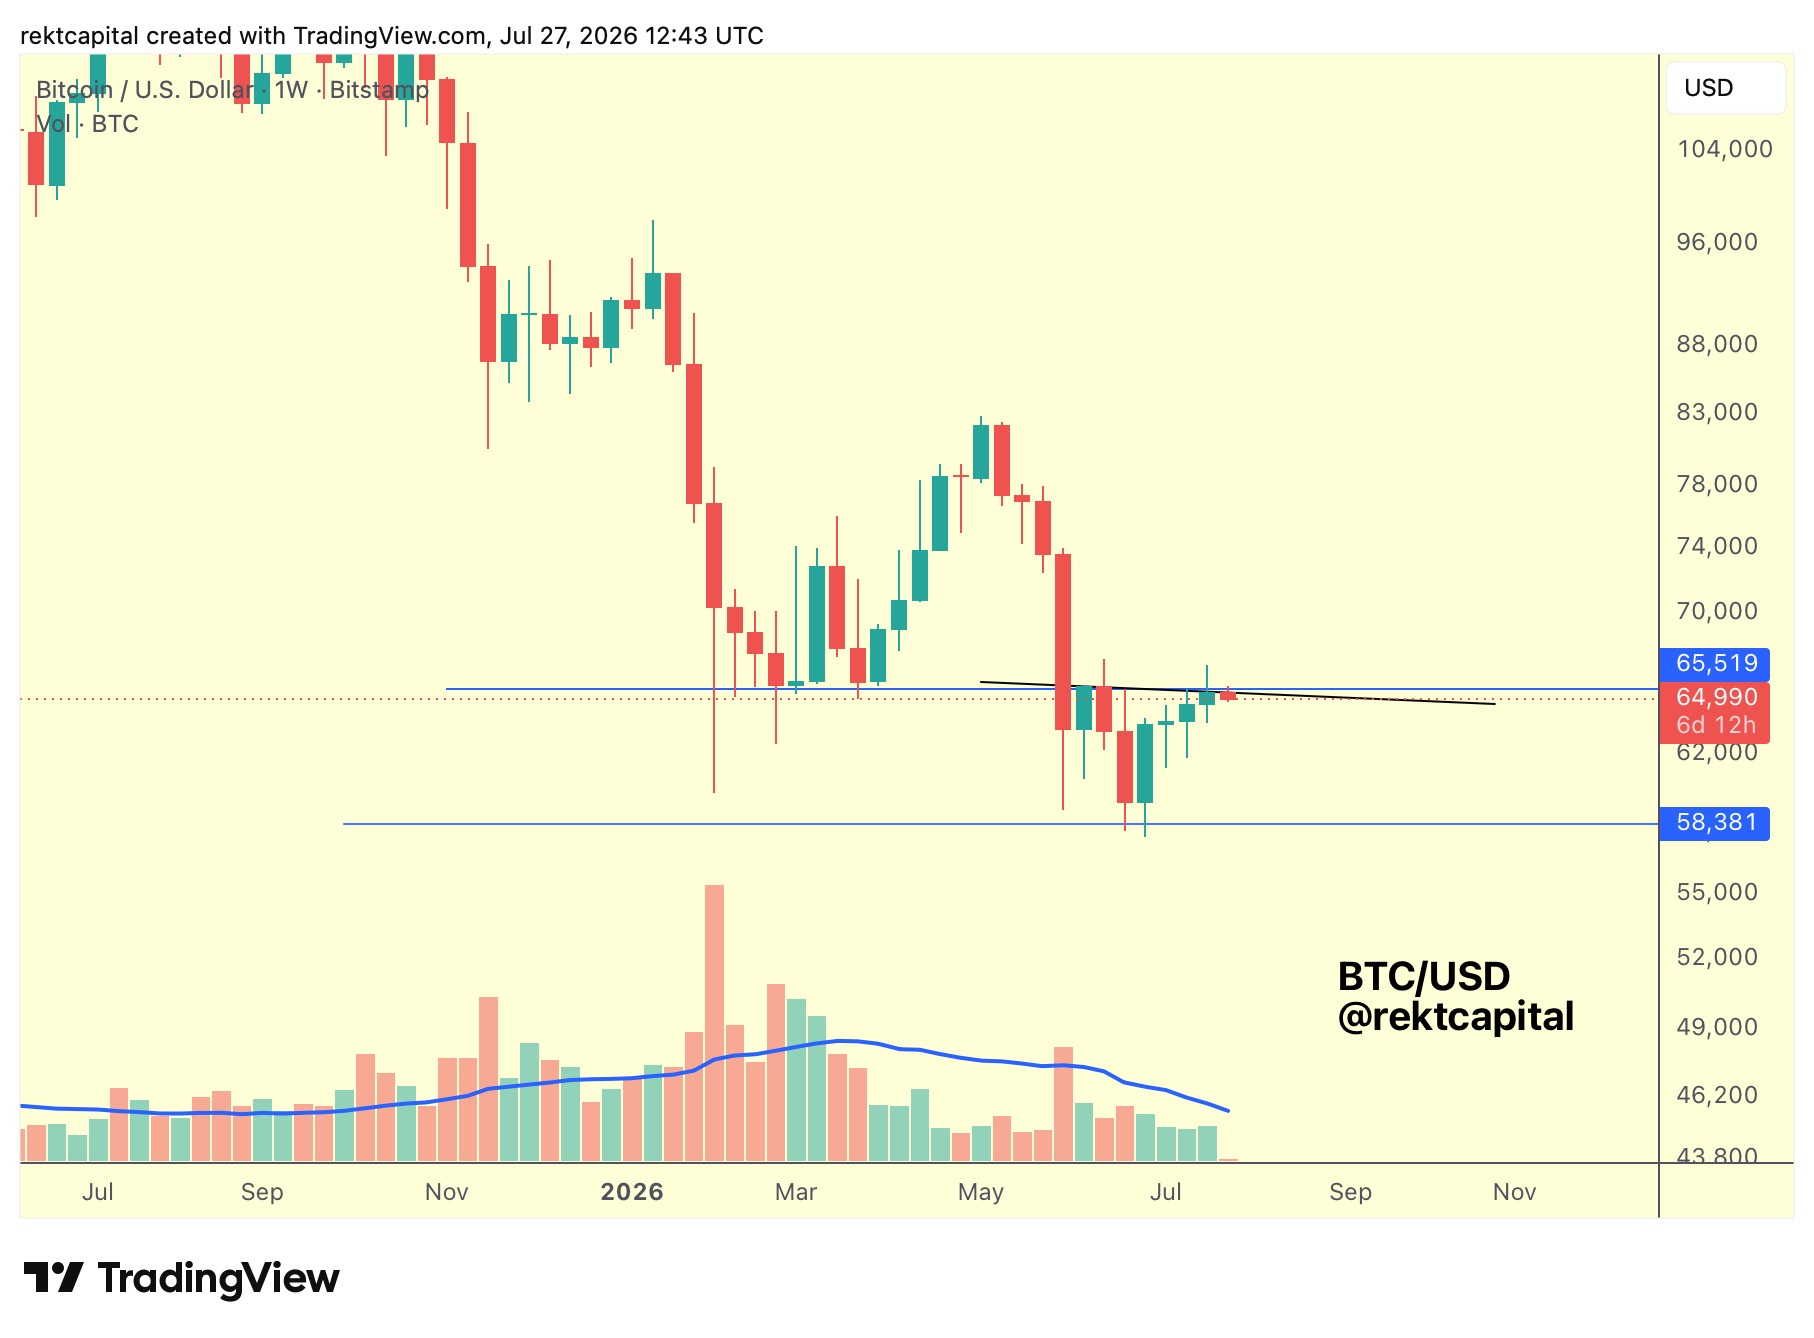
What volume and market structure are both telling us matters a lot in the context of this current Summer Range.
While the Range High resistance at the blue level continues to act as a ceiling for price, Bitcoin may also be in the process of carving out a new Lower High here.
The Macro Lower High dating to October 2025 is already well established, but a smaller, week-to-week Lower High now appears to be developing alongside it (black trendline).
On the volume side, buy-side participation had been declining, and at one point even printed a seller-dominated volume bar. That bar ultimately closed green by the Weekly Close, though, so we're no longer looking at outright declining buy-side volume in the immediate term.
If we zoom out all the way to early June to take into account the broader trend of volume though, the buy-side volume is still in decline, even if there's been no new price acceleration lower.
The buy-side volume has, however, stayed relatively consistent at this resistance rather than deteriorating further in recent weeks, but it has been consistently below-average and there has been no real breakout in it so far (necessary to spike a major move in price).
That volume breakout is exactly what would be needed to propel price into higher levels from here but history suggests price may favour downside heading into August and here's why: