Is Bitcoin Running Out Of Steam At Current Highs?
Here's what Bitcoin needs to do to a) confirm downside from here vs b) reclaim key levels to flip bullish.
Welcome to the Rekt Capital Newsletter, a resource for investors who want to better navigate the crypto markets with the help of cutting-edge crypto research and unbiased market analysis.
A Monthly Close With Consequences
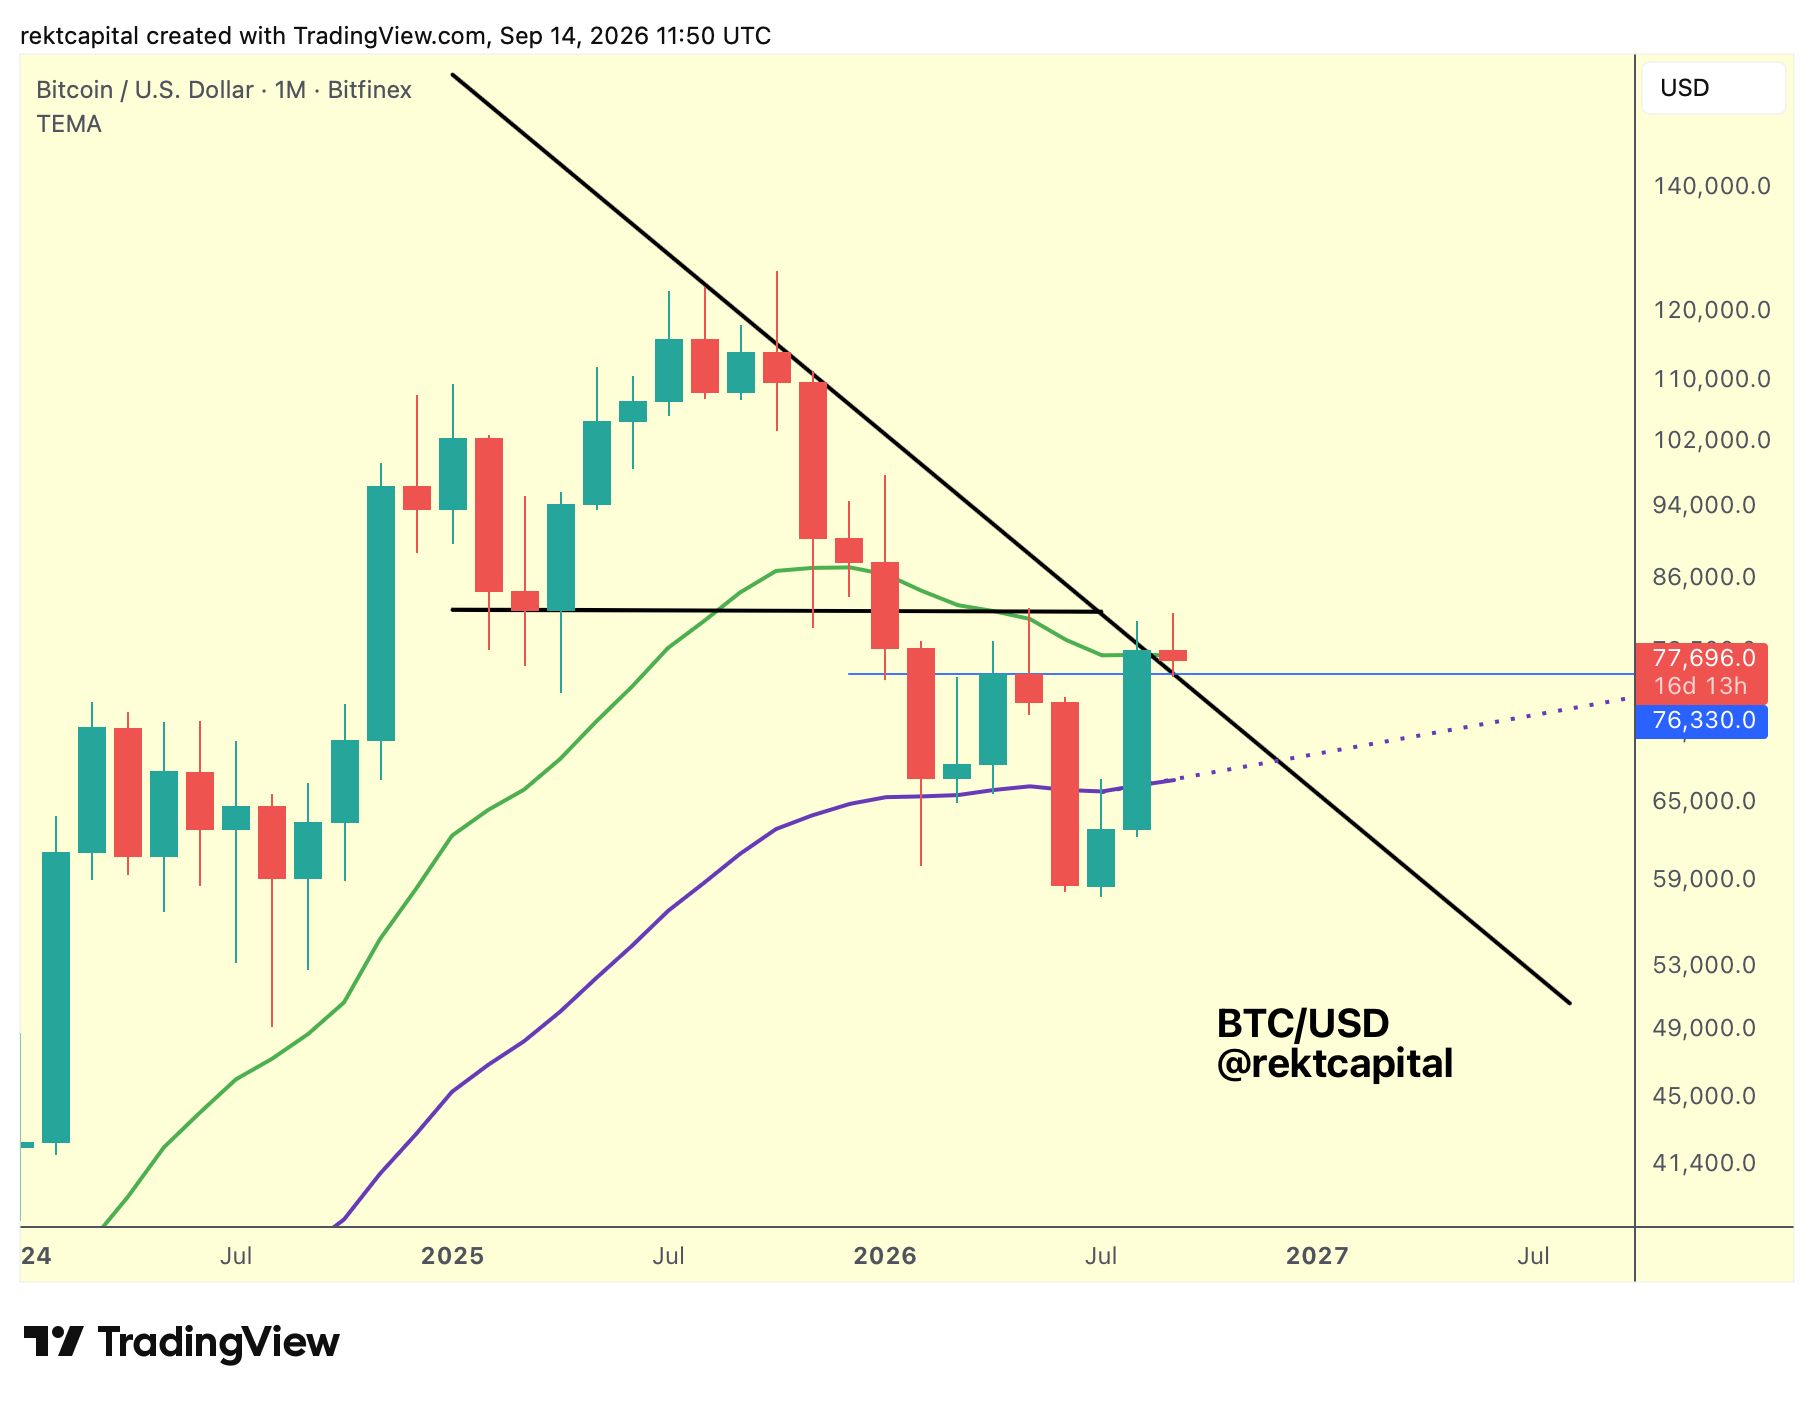
The macro downtrend is the technical line of best fit drawn back in November and extrapolated since, and it has been a pretty consistent point of reaction.
Initially rejection.
Now potentially reaction as a support.
But Bitcoin Monthly Closed below the macro downtrend (black trendline) in August, and this September, by virtue of time alone, price has closed just above that dynamic resistance.
Price is now trying to turn the April-May highs at $76,330 (blue horizontal), confluent with the macro downtrend, into new support.
This is technically a retest in progress.
Of course, Bitcoin could end the month below the macro downtrend and even turn it back into resistance, because technically that is what it has been acting as all along.
Which makes the Monthly Close pivotal in establishing that positioning.
If Bitcoin closed at a snapshot right now, October would open around here, and that would be quite a substantial distance to travel for any retest of the macro downtrend later (because the Downtrend is a dynamic support/resistance).
At the moment price is retesting the April-May highs while keeping the macro downtrend as new support.
But weakness is showing on the Daily and Weekly, and the 21-month EMA here (green) is struggling to hold as support, at the time of this writing.
Bitcoin could still close above that level, as price doesn't need to bounce too much from current prices to lift itself above the 21-Month EMA (green), but it's likely price will likely meander around here for a good few more weeks, teasing support and resistance consistently during that time.
Failing this macro downtrend and these April-May highs simply continues the consolidation between the two key higher timeframe moving averages.
If the green 21-month EMA is a Range High resistance and the 50-month EMA (purple) is a Range Low, then Bitcoin is just consolidating between the two, producing deviations below the 50-month EMA and also beyond the 21-month EMA.
If we remove the drawings, then it all comes down to this:
Can Bitcoin breakout from the Range developed by the two major EMAs: the 50-month EMA (purple) and the 21-Month EMA (green)?