Altcoin Newsletter #275
Features analysis on Altcoins such as DOGE JUP RENDER SOL XLM XMR PENGU
Welcome to the Rekt Capital Newsletter, a resource for investors who want to better navigate the crypto markets with the help of cutting-edge crypto research and unbiased market analysis.
***IMPORTANT ANNOUNCEMENT***
The new home for all Rekt Capital Newsletter content is now at https://newsletter.rektcapital.co.uk and our website is now at https://rektcapital.co.uk.
Please bookmark these two websites.
You will still receive newsletters as normal - straight into your inbox, three times a week but if you’d like to access the newsletters online please visit our new website https://newsletter.rektcapital.co.uk
In today’s Altcoin newsletter I cover the following Altcoins – specifically:
- Dogecoin (DOGE)
- Jupiter (JUP)
- Render (RENDER)
- Solana (SOL)
- Stellar (XLM)
- Monero (XMR)
- Pudgy Penguins (PENGU)
These Altcoin TA requests are made by valued readers of the Rekt Capital Premium Newsletter.
Let’s dive in...
Dogecoin – DOGE/USDT
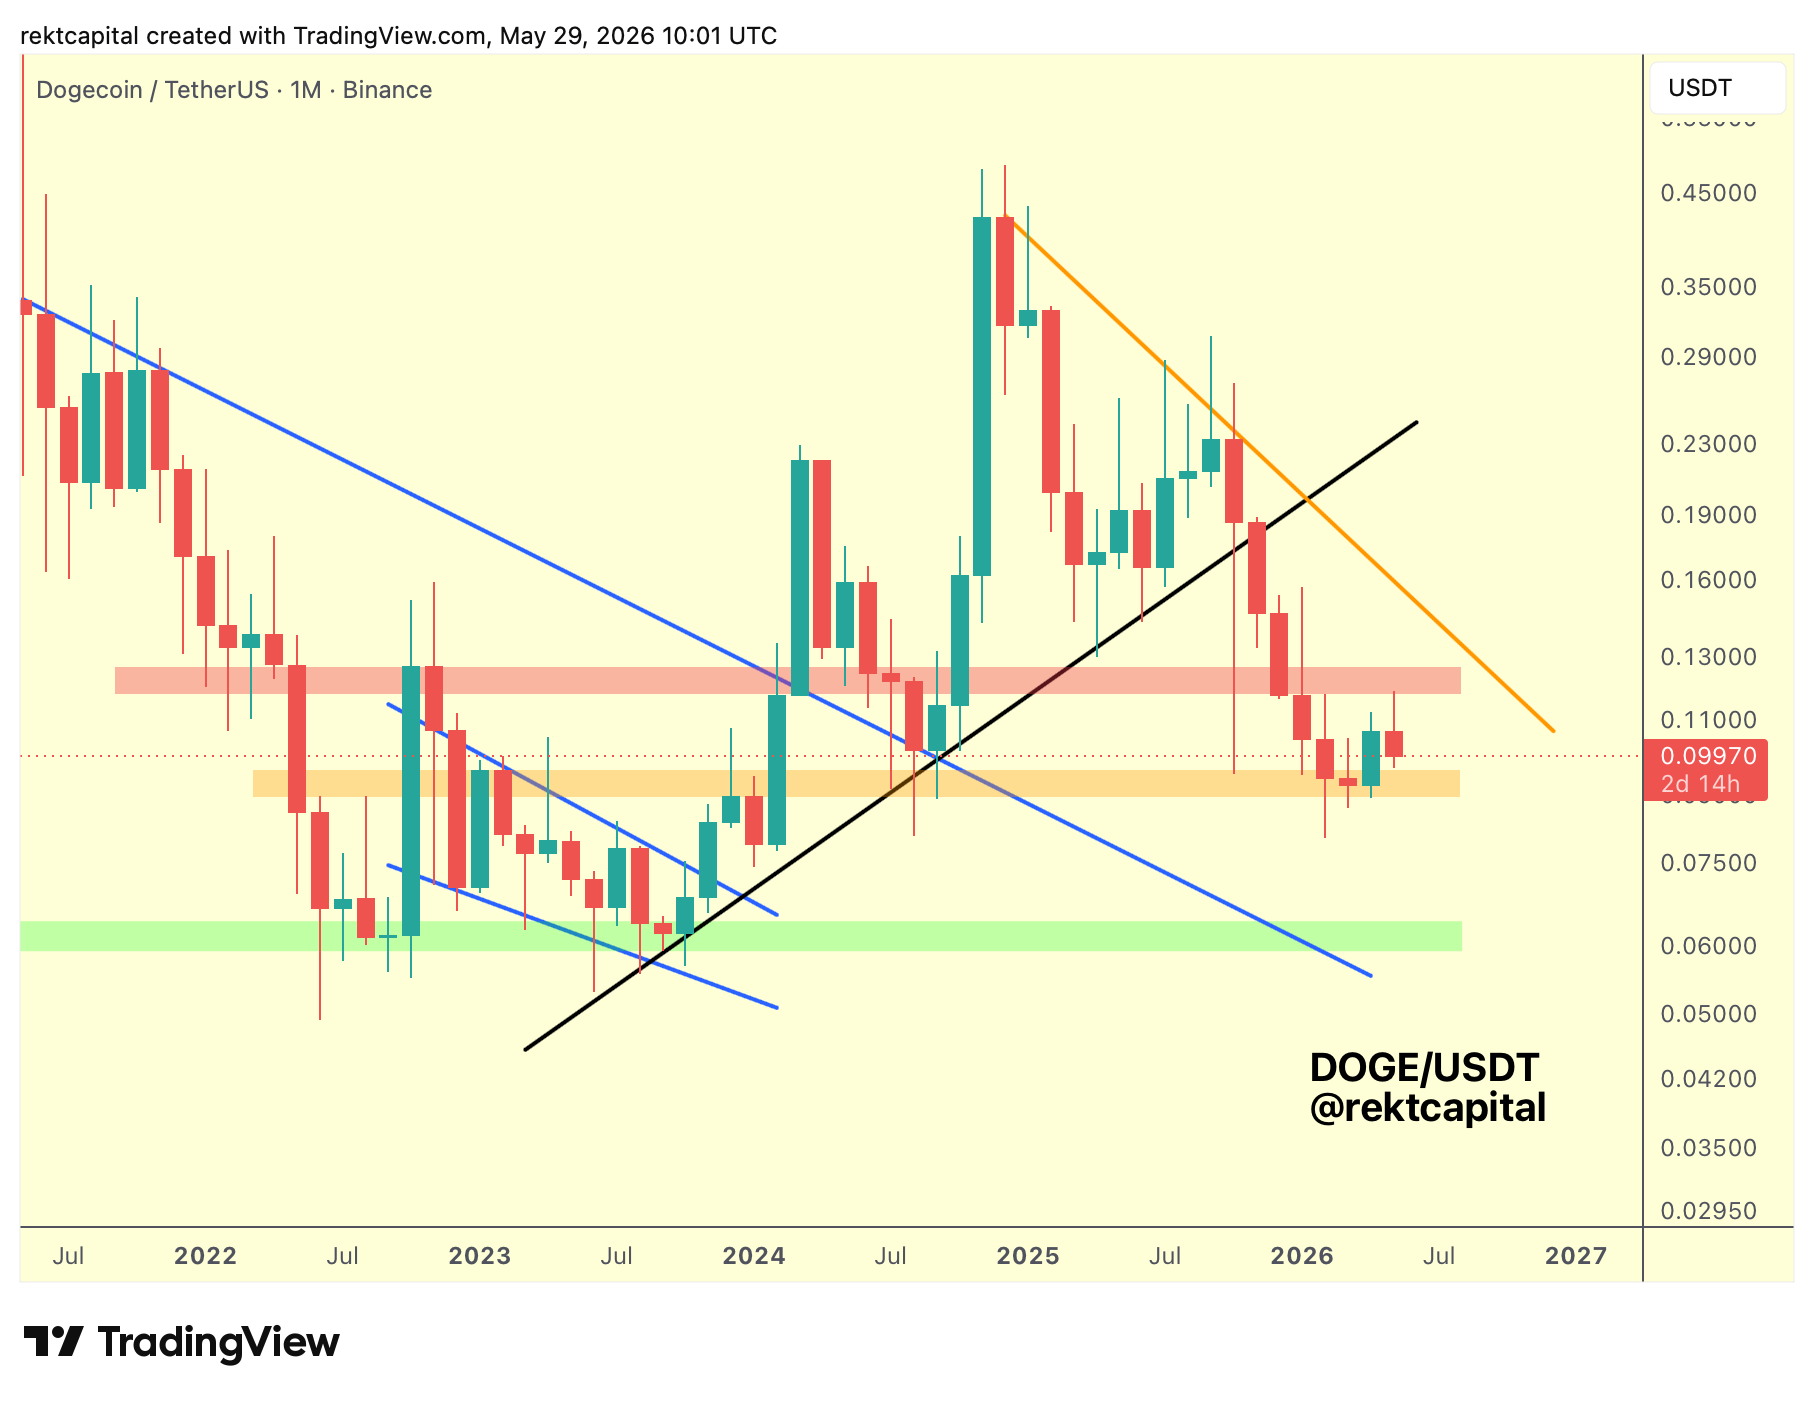
Over recent months, DOGE has been operating within a defined range, from the orange zone (orange horizontal zone, Range Low support) at the base up to the red zone (red horizontal zone, Range High resistance) above.
Price built a multi-month base at the Range Low, and that consolidation did enable the move into the Range High. That sequence played out as anticipated.
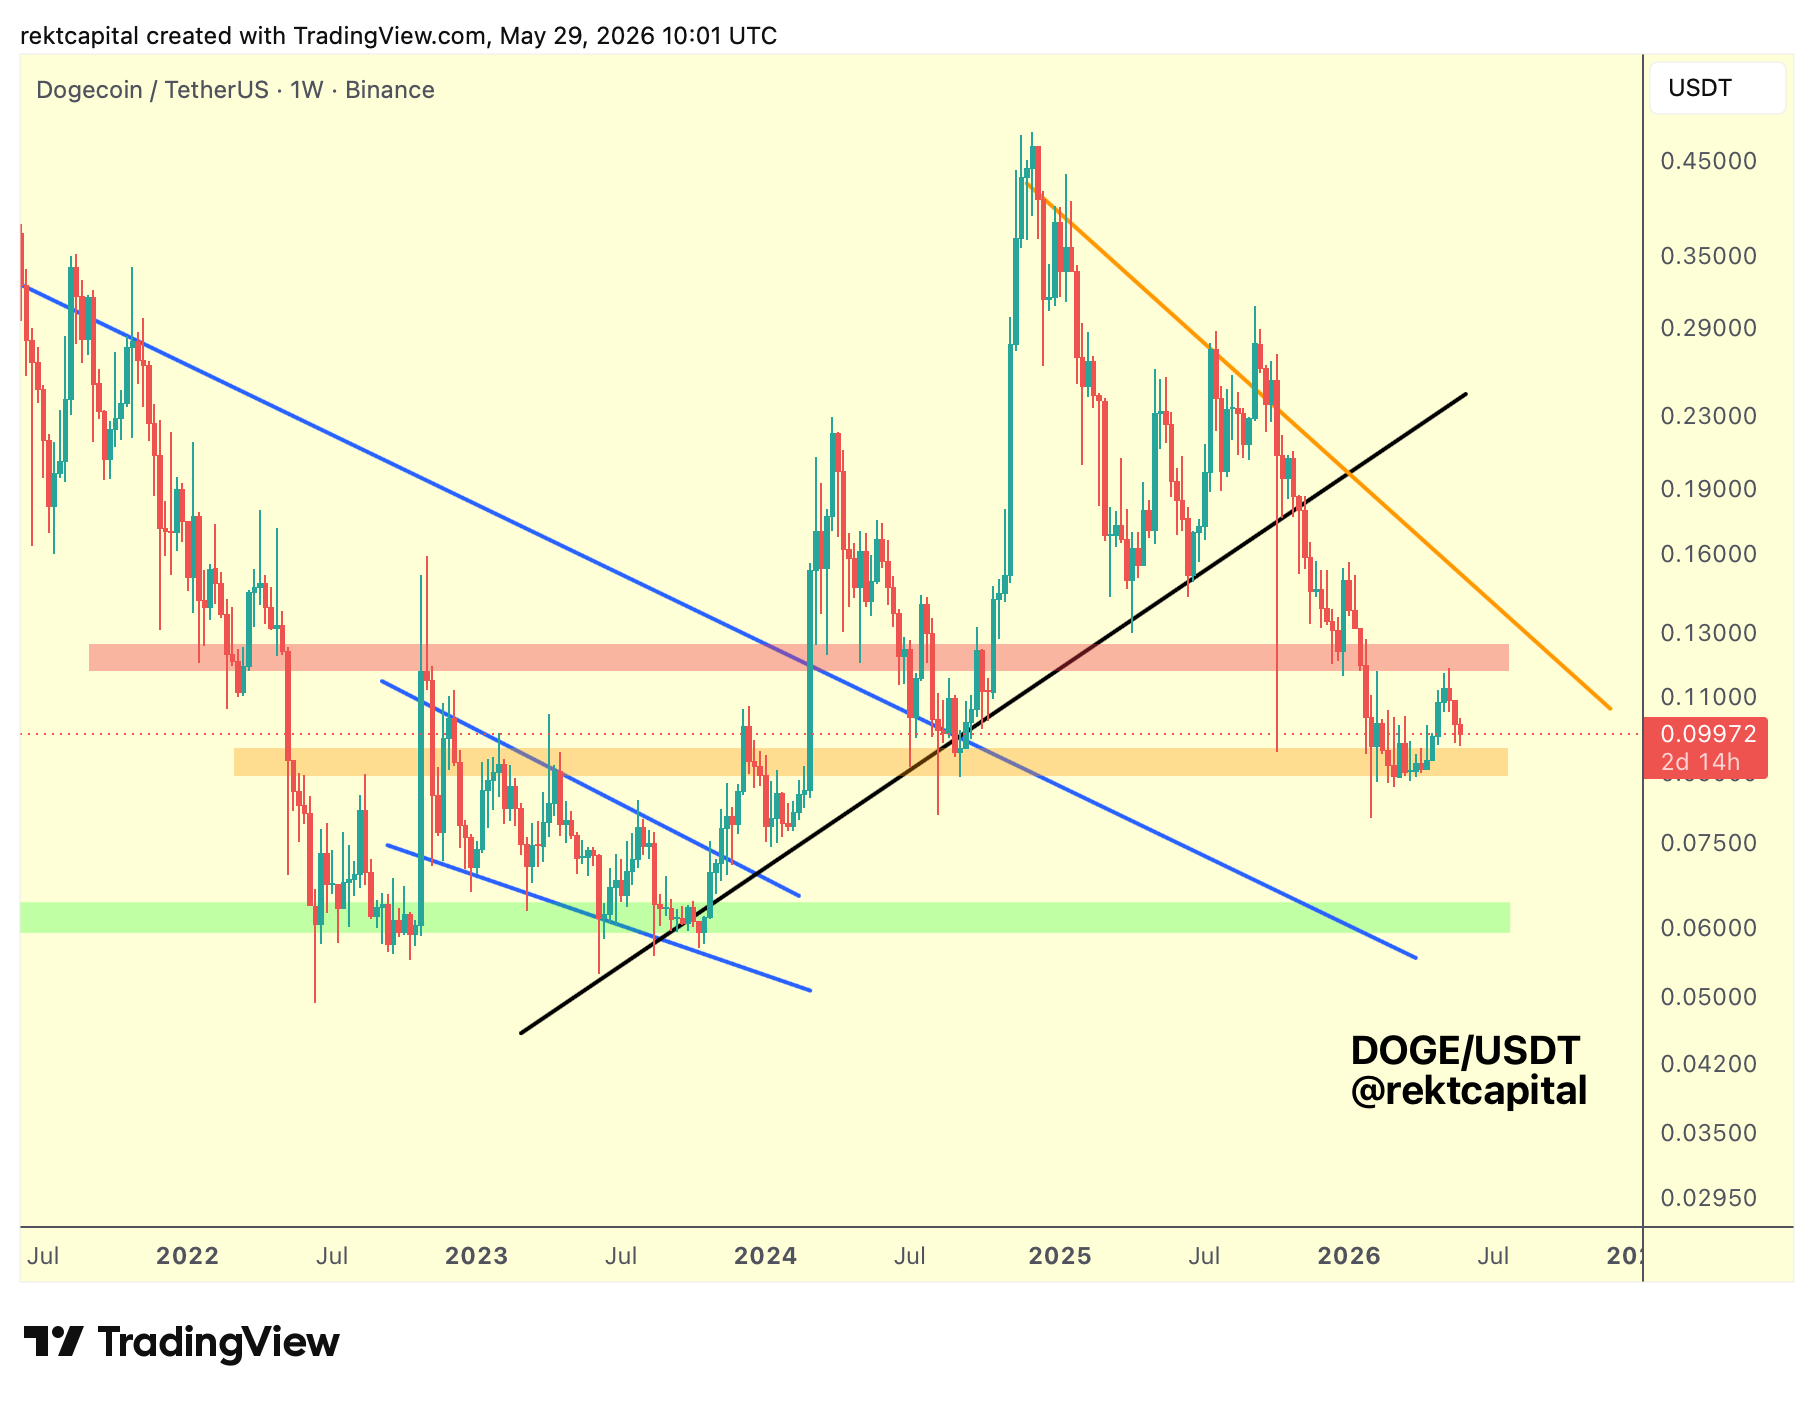
Having travelled from Range Low to Range High, price is now meandering back toward the orange zone.
The critical question is whether a Higher Low develops here.
Failing to form a Higher Low at the Range Low would open the door to a more concerning scenario: losing the orange zone and flipping it into resistance.
That would transition price into the range below between the green zone (green horizontal zone, macro support) and the orange zone, a region that historically served as a bottoming area in 2022 and 2023.
The pattern of continued Lower Highs developing across this structure only adds weight to that breakdown risk.
Jupiter – JUP/USDT
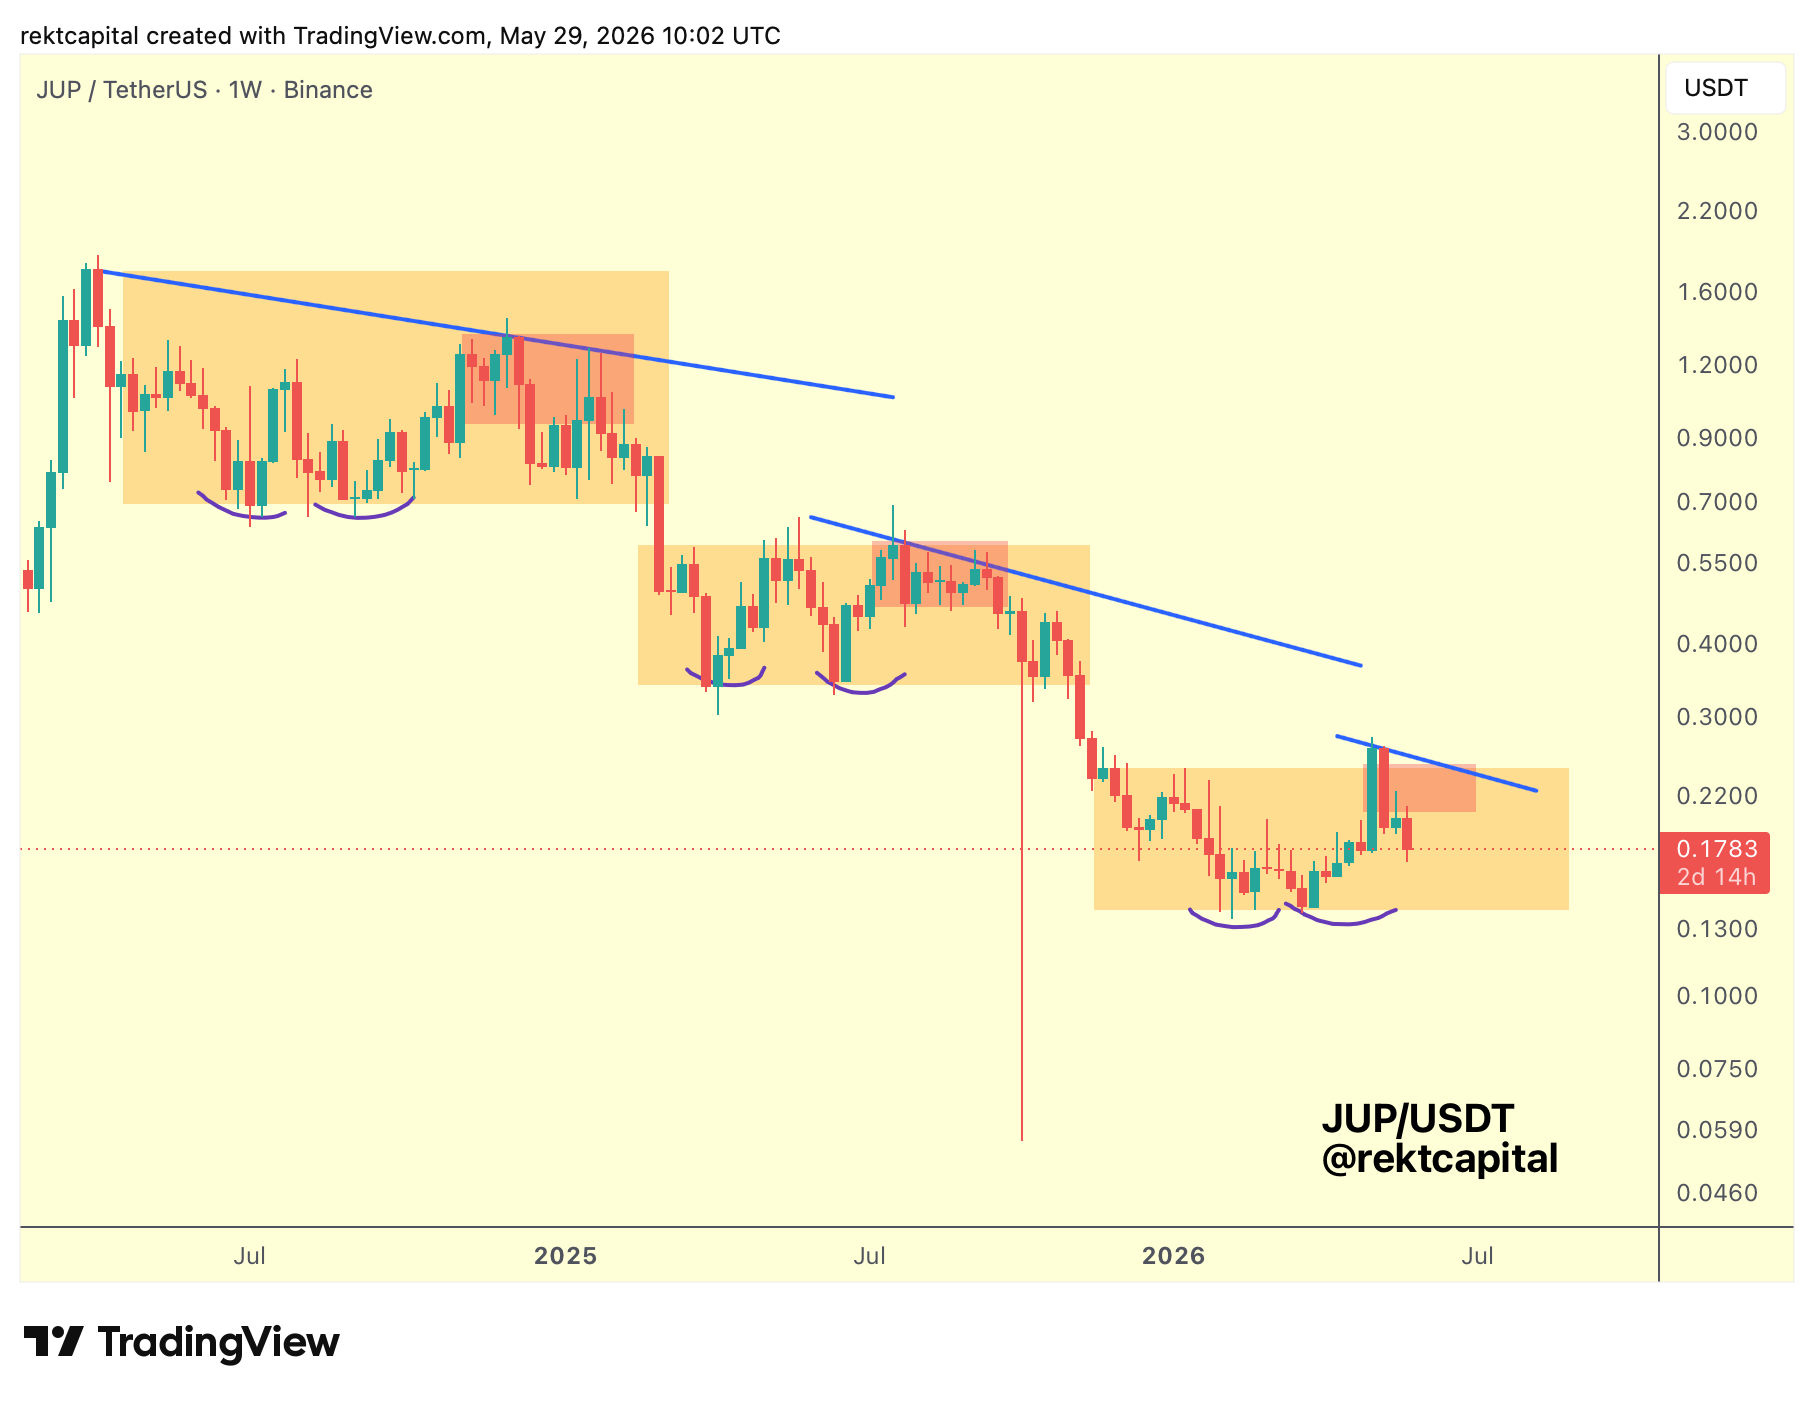
The fractal has been playing out with precision.
The pattern is built on a repeating sequence: a Double Bottom at the base of each orange cluster, followed by a rally into a Lower High, and then distribution back down toward the bottom of the formation.
That sequence has now repeated across three successive clusters on this chart, each marked by the purple Double Bottom arcs.
The current cluster is forming in the same way: a Double Bottom has developed, and price is now attempting to build a Lower High.
These Lower Highs do take time to form.
Looking at prior clusters, price has occasionally dipped close to the bottom of the formation before establishing the Lower High and that tendency remains in play here.
Whether this pullback deepens slightly before the Lower High develops, or whether price moves into the Lower High more directly, both are valid paths within the fractal.
What matters is the broader sequence.
This pullback is effectively part of forming that Lower High and once it does, distribution back toward the bottom of the current cluster would be the next expected step, consistent with every prior iteration of this fractal.