Altcoin Watchlist #151
Features analysis on Altcoins such as AERO HBAR HYPE JUP SOL OKB BNB
Hello and welcome back to the Rekt Capital Newsletter
In today’s edition, the following cryptocurrencies will be analysed & discussed:
- Aerodrome Finance (AERO)
- Hedera Hashgraph (HBAR)
- Hyperliquid (HYPE)
- Jupiter (JUP)
- Solana (SOL)
- OKB (OKB)
- Binance Coin (BNB)
But before we dive in, this Friday I’ll chart your Altcoin picks in an exclusive subscriber-only TA newsletter and will cover as many as I can
So if you’d like to have an Altcoin charted, feel free to share max. two TA requests each in the comments below.
I’ll chart the Altcoins that get mentioned and ‘Liked’ the most
Click the button below to leave a comment with your TA request!
Let's dive in to today's Altcoin Market Update.
Aerodrome Finance – AERO/USDT
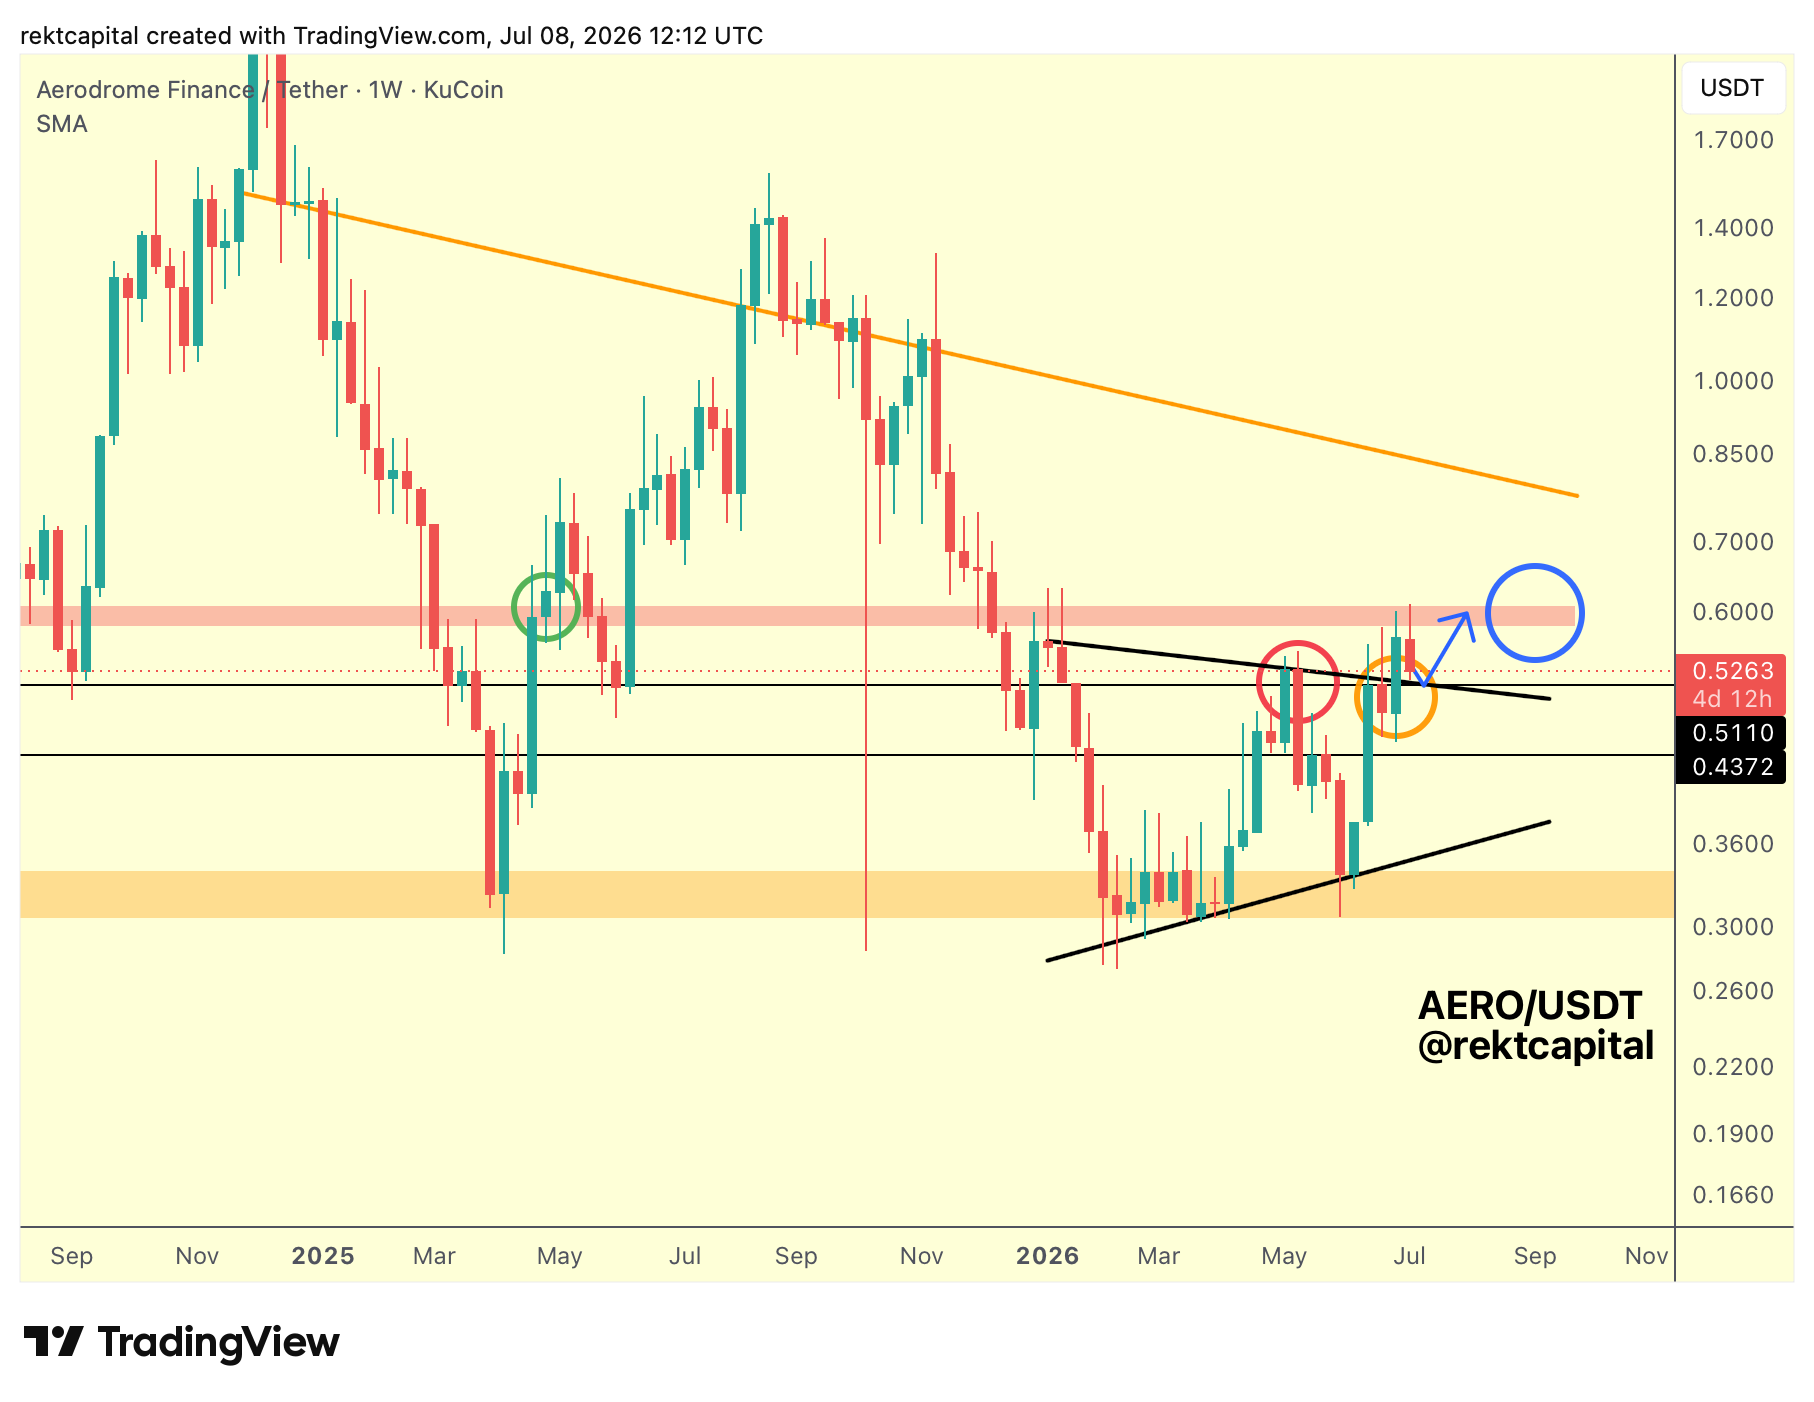
Aerodrome Finance is developing a macro triangular market structure on the Weekly, and price had been consolidating beneath the Lower High that defines the top of that structure.
That Lower High has now been broken. Price has Weekly Closed above it, and the breakout is confluent with the Range High resistance at $0.5110 (black horizontal), reinforcing the significance of the move.
The focus now shifts to a Post-Breakout Retest of that same level. A successful retest here would most likely enable a revisit of the red zone (horizontal, macro resistance) around $0.60.
From there, a Weekly Close inside or above the red zone becomes the next requirement.
Confirming that with a Post-Breakout Retest of the zone as new support would then open the path toward as high as the orange trendline (descending, Macro Downtrend) above.
For now though, the retest at $0.5110 comes first. Only once that holds can price follow through on the move higher.
Hedera Hashgraph – HBAR/USD
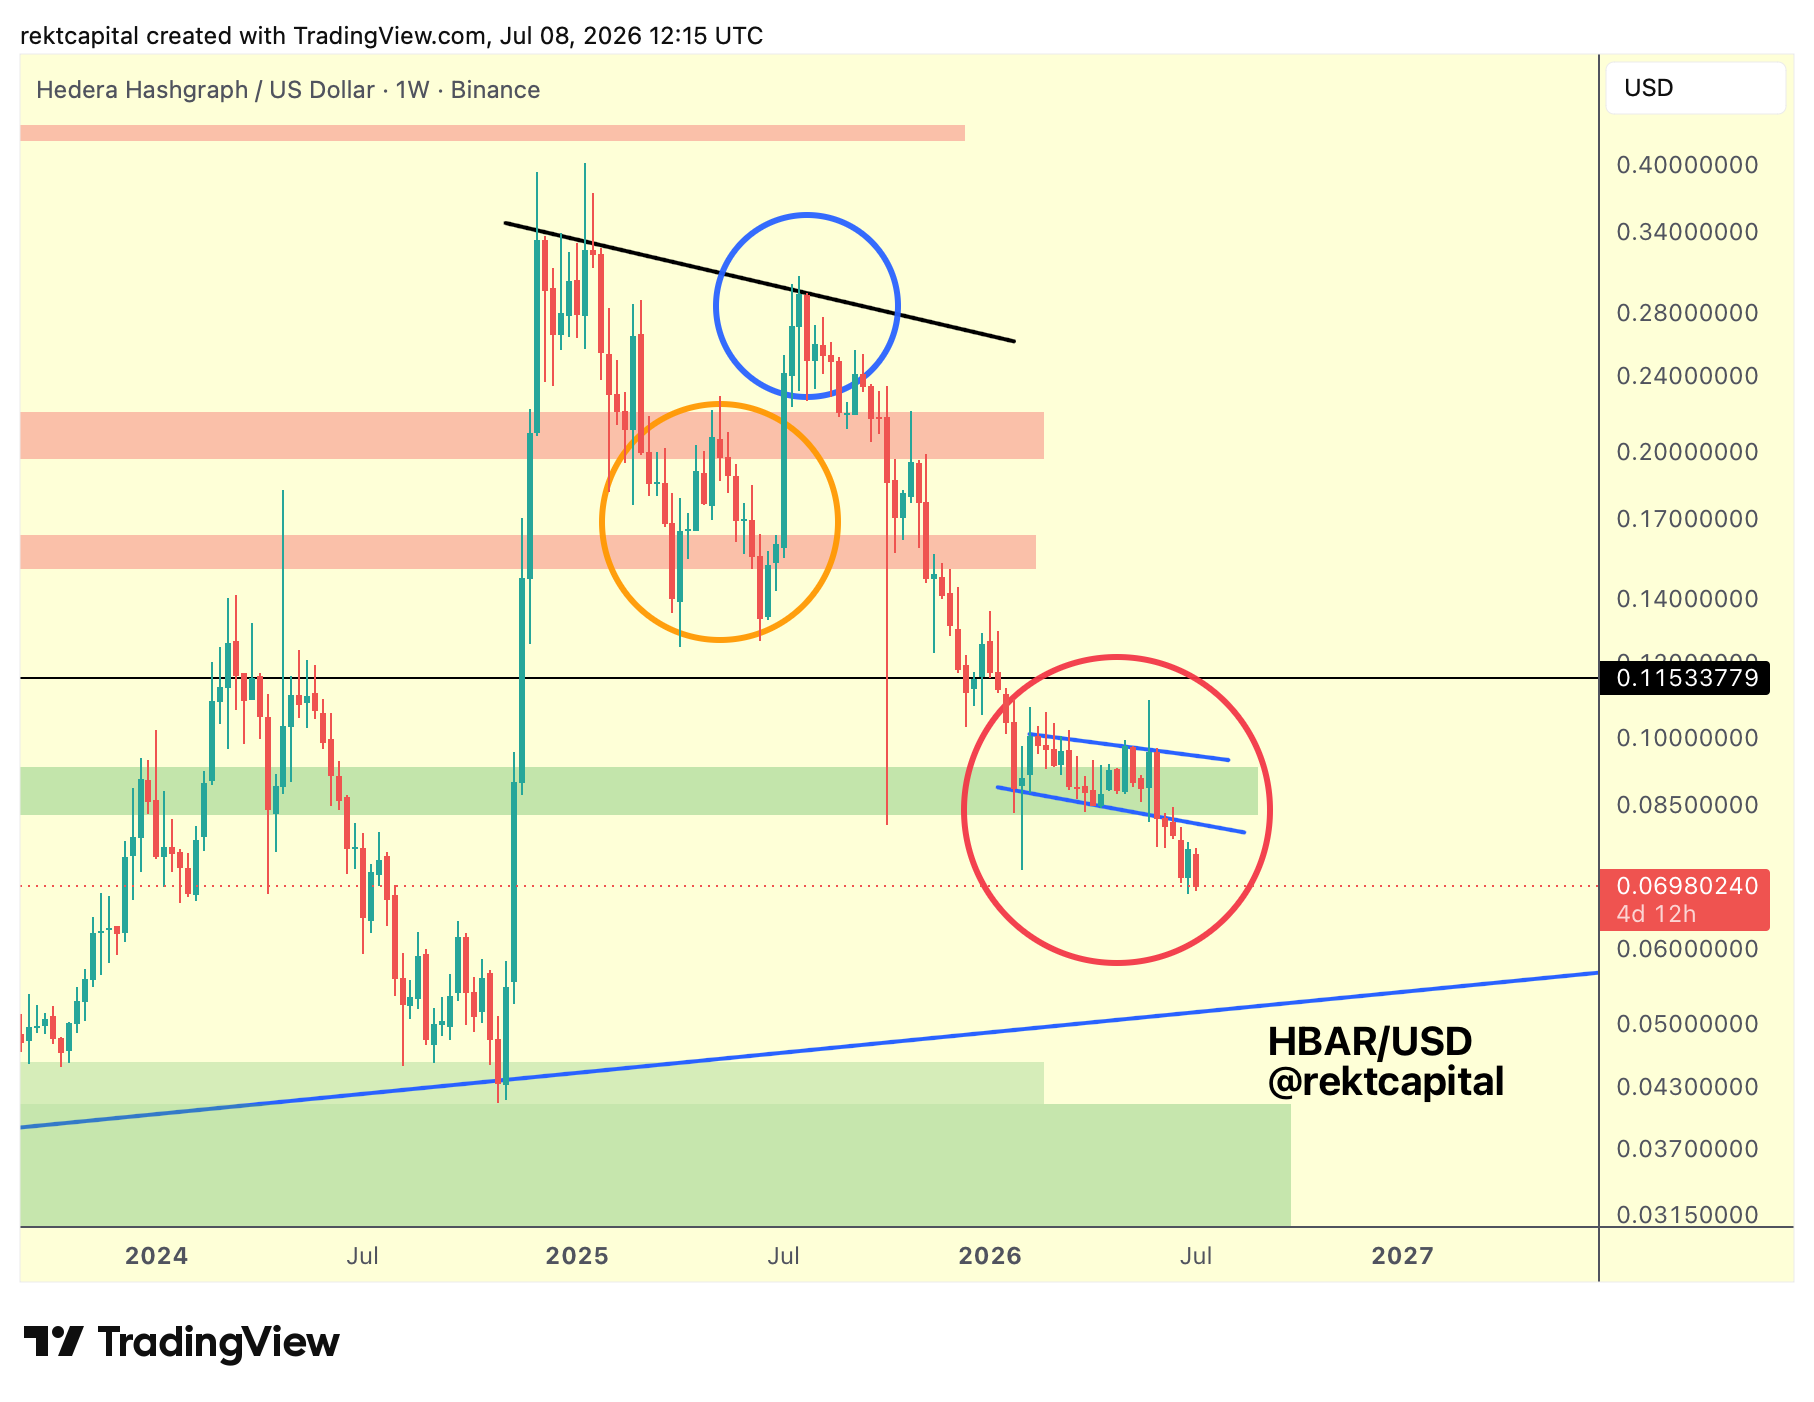
Hedera Hashgraph has been trading beneath a historical demand area, the green zone (horizontal, historical demand), while price built out a downtrending channel just above it.
A breakdown from that channel, turning its base into new resistance, would likely see price dissipate a little lower from here.
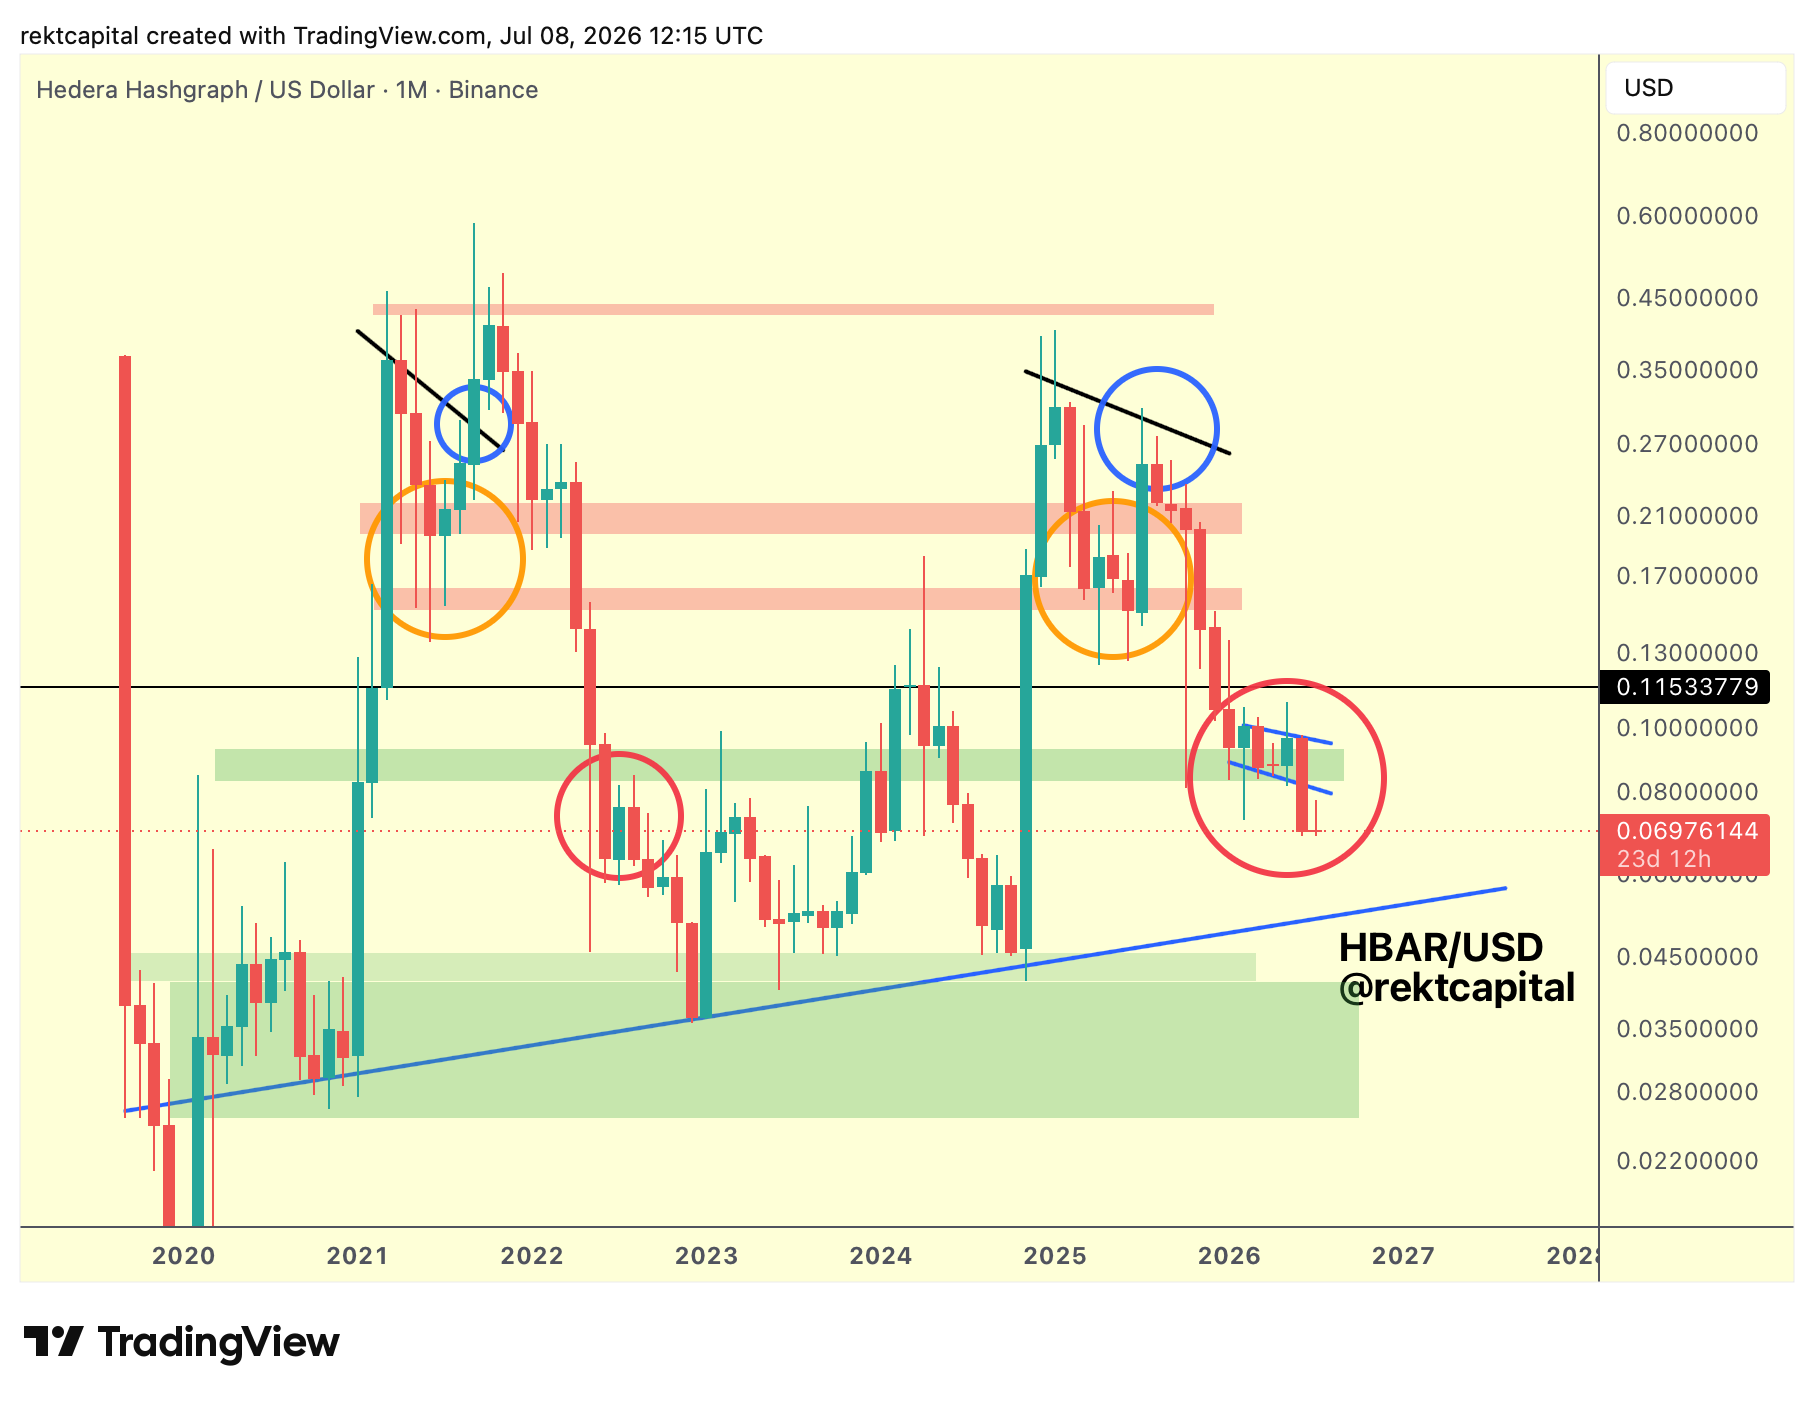
That breakdown has now played out.
The behaviour closely mirrors what Hedera Hashgraph produced through the summer of 2022, and the comparison between the current red-circled region and the 2022 red-circled region makes that resemblance clear.
The same pattern shows up when comparing this setup to Bitcoin relative to its purple 50-month exponential moving average:
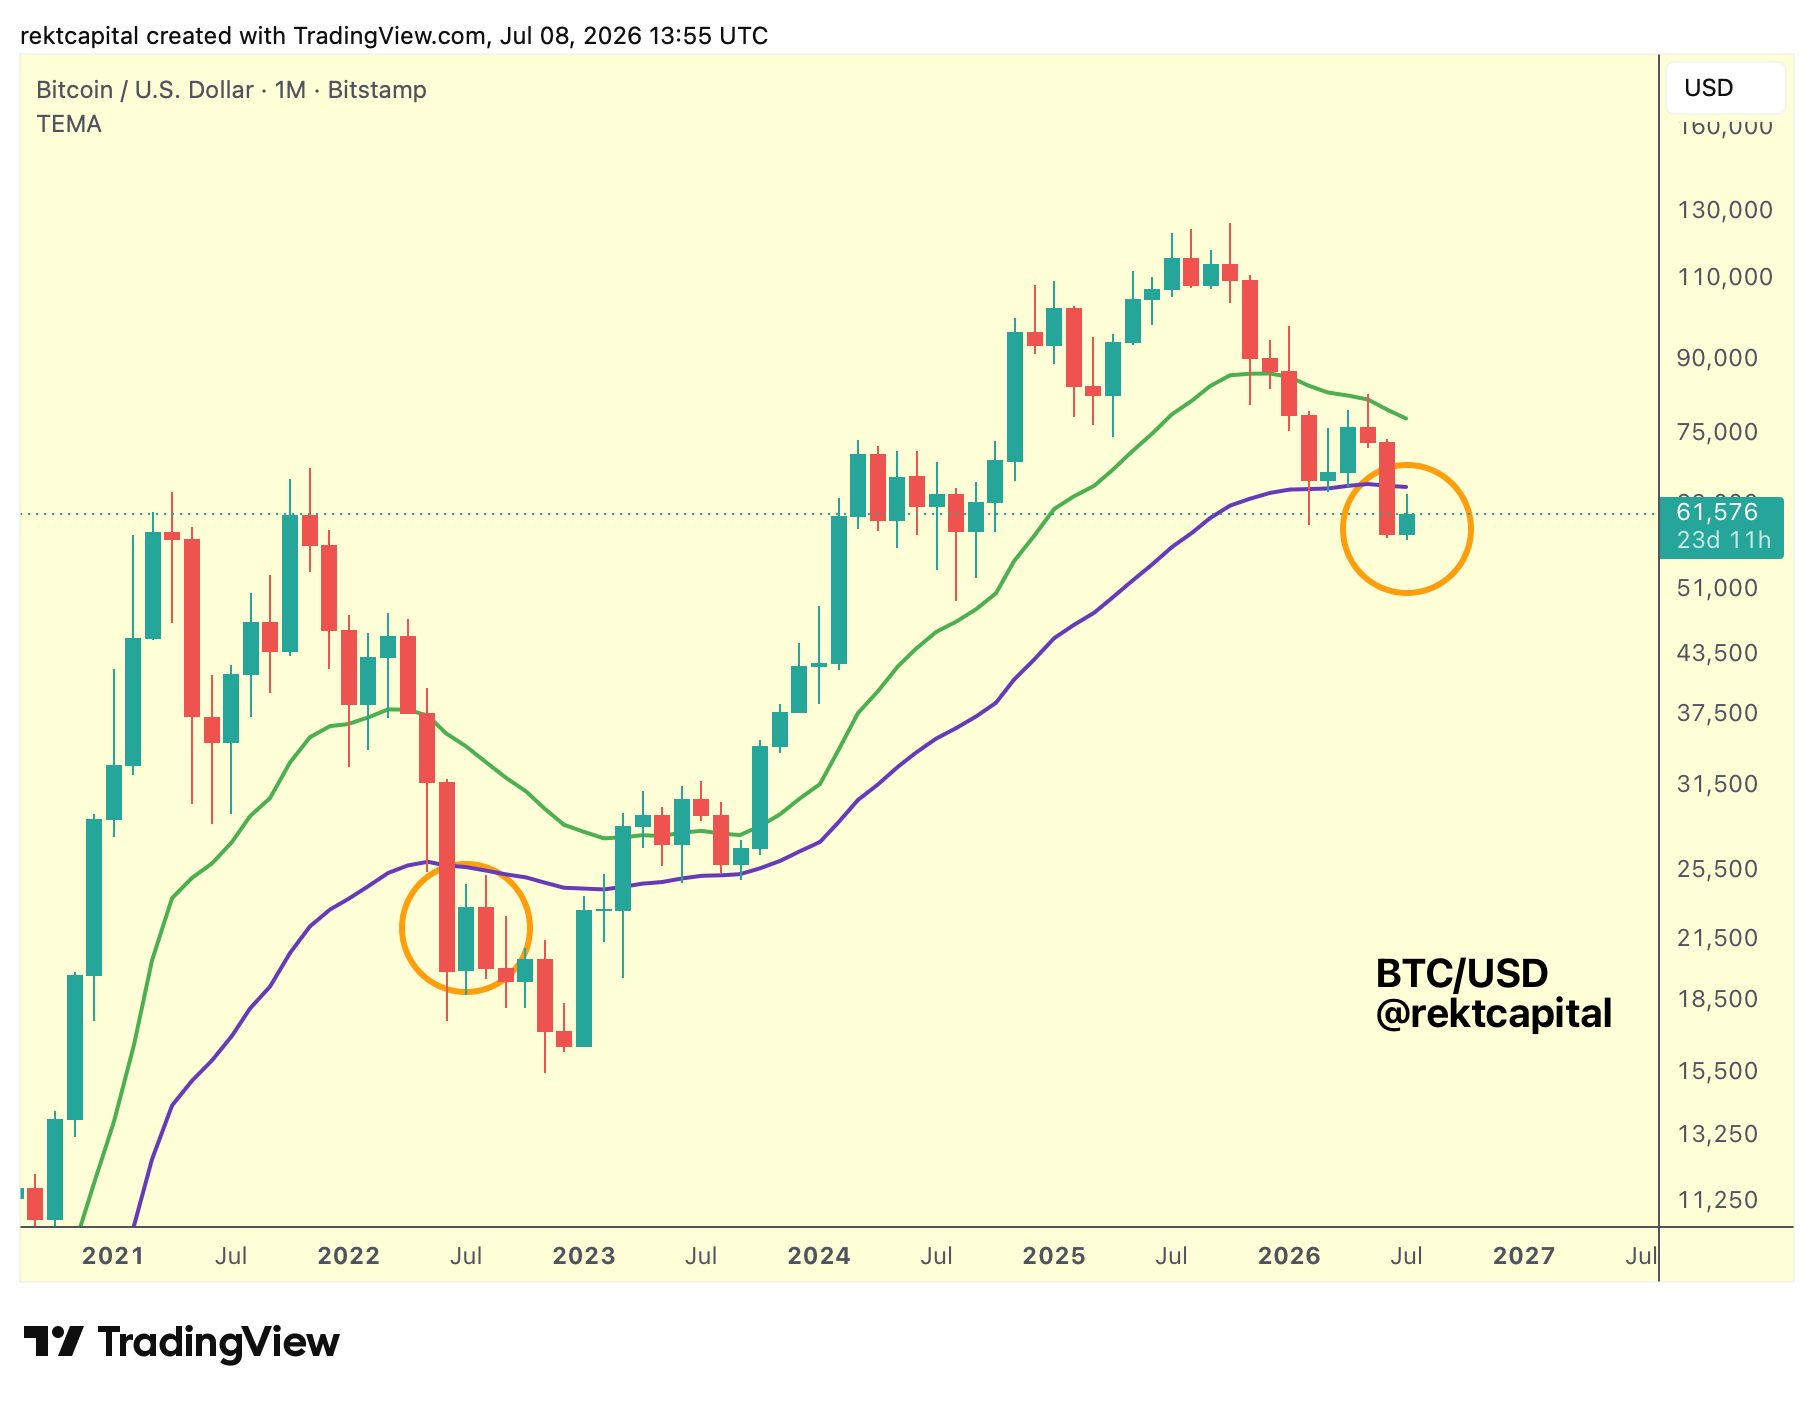
Bitcoin's summer range in 2022 saw a bearish retest of the underside of that moving average, and the same behaviour is repeating in the current cycle.
For Hedera Hashgraph, the green zone functions as the analog to Bitcoin's 50-month EMA.
It flipped into resistance back in 2022, and it appears to be doing so again now.
Should that resistance continue to hold, the implication is a drift closer to the blue trendline (ascending, multi-year uptrend support), which resides somewhat lower on the chart.