Bitcoin - How To Navigate The Summer and Beyond
Why the six-month chart isn't as clean as it looks
Welcome to the Rekt Capital Newsletter, a resource for investors who want to better navigate the crypto markets with the help of cutting-edge crypto research and unbiased market analysis.
Is the 200-Week SMA Turning Into Support Again?
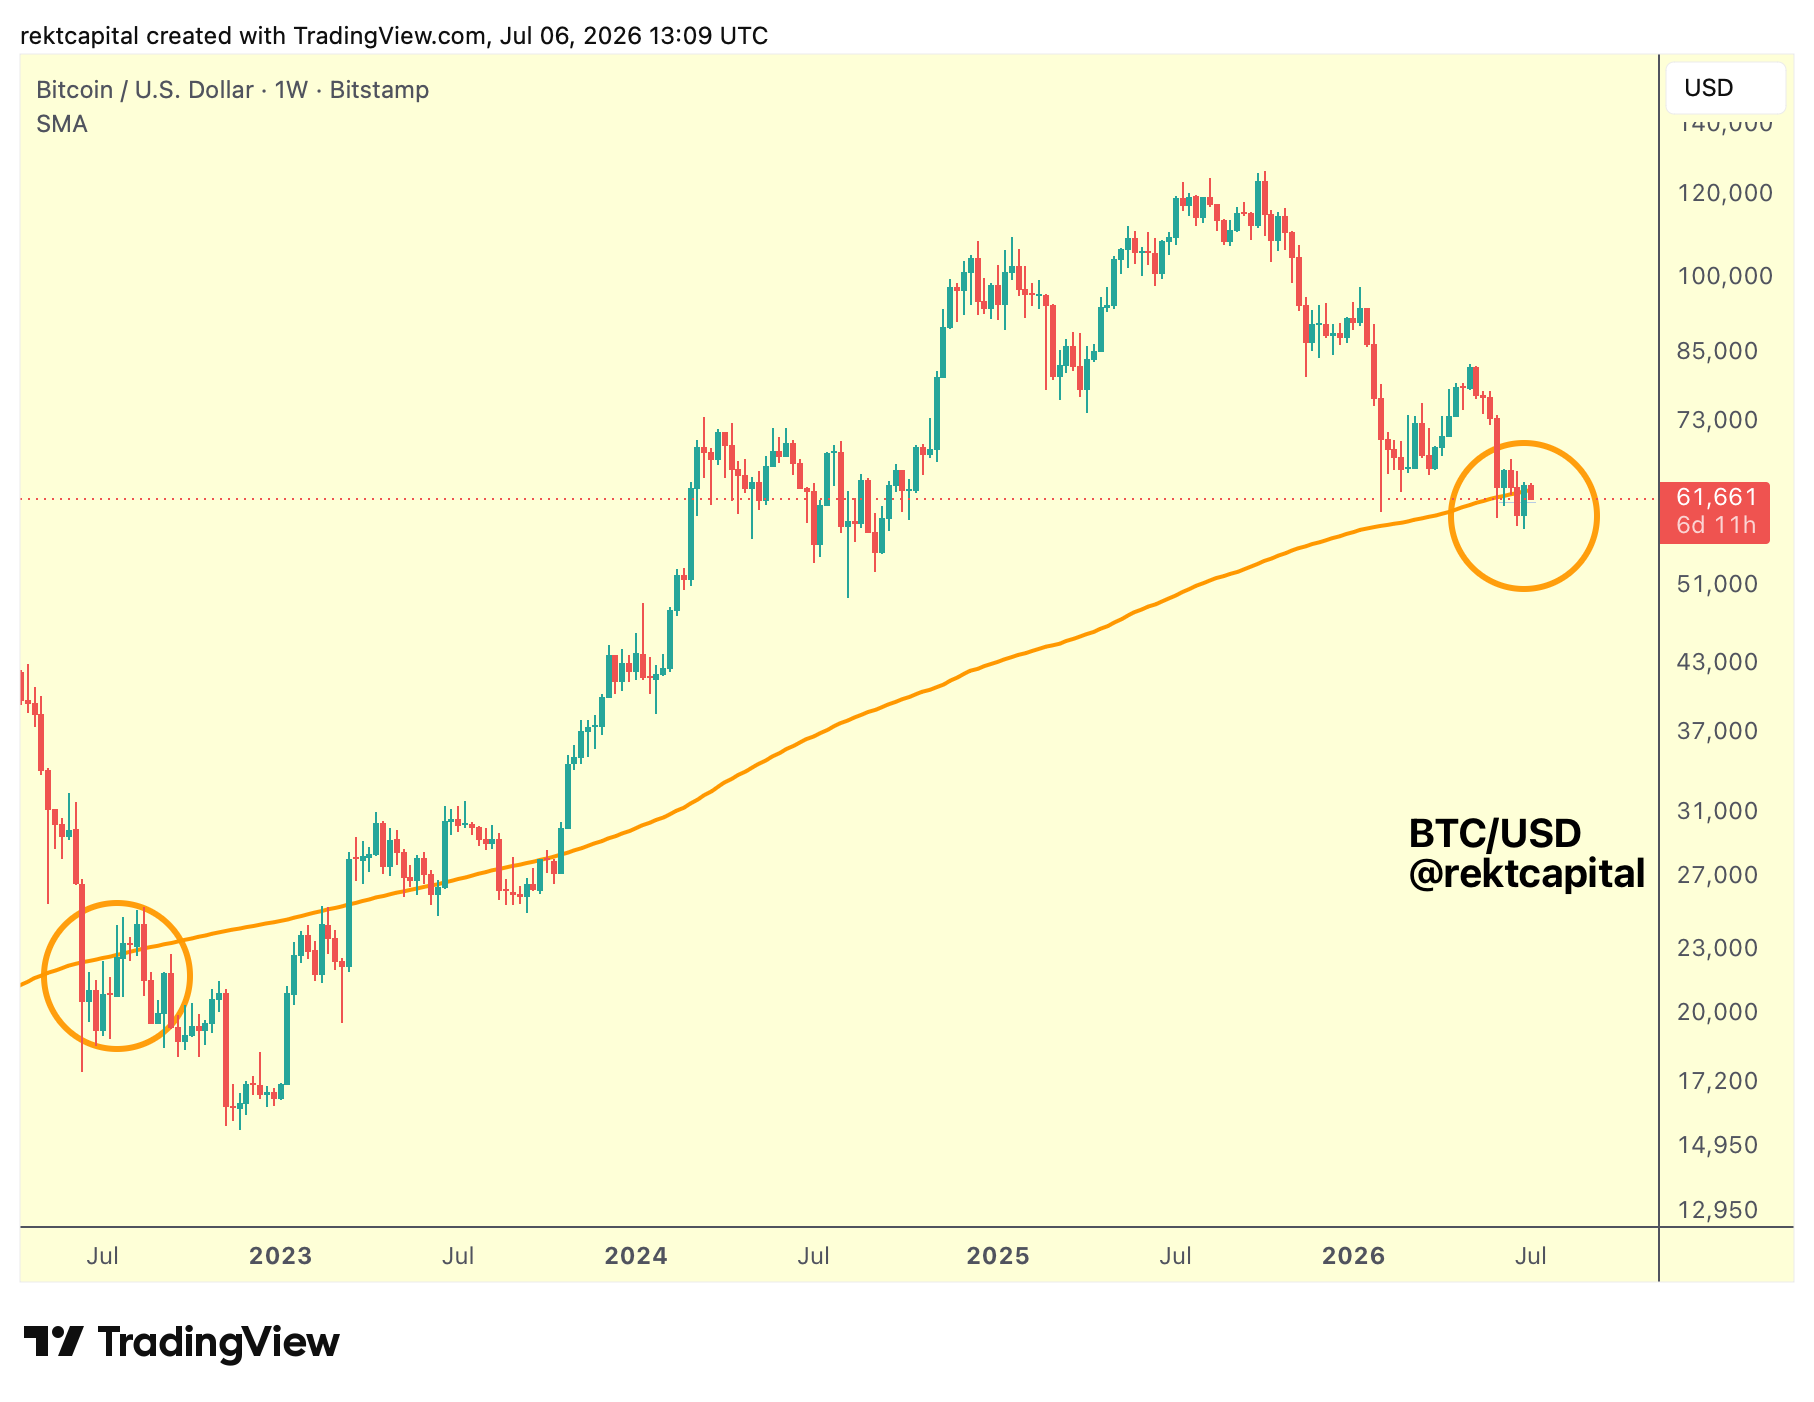
Bitcoin remains locked in on the Weekly timeframe around the 200-week SMA (orange).
The broader expectation hasn't changed: a downside deviation below this SMA still remains the base case over the coming months.
But in the short term, this level could get noisy.
In 2022, the same SMA acted as both unreliable support and unreliable resistance before price was ready to commit to new Lower Highs and continue lower.
I expect a similar phase now.
Four years ago, price deviated below the 200-week SMA in June.
This cycle, June also produced a deviation below it, initially as a downside wick but then breaking down from it completely.
Most recently, Bitcoin has produced a Weekly Close back above the 200-week SMA, technically classifying this as a Post-Breakout Retest of the level.
If this retest holds, the SMA could function as short-term support again this week.
The current dip will show us whether that reclaim sticks; thus, the short-term retest in in progress now.
But nothing about the mid-term thesis shifts either way.
The deeper deviation beneath the 200-week SMA is still likely coming.
The real question is how we get there, and what price does week to week before that deeper move begins.
Red June, Green July: Is History Repeating?
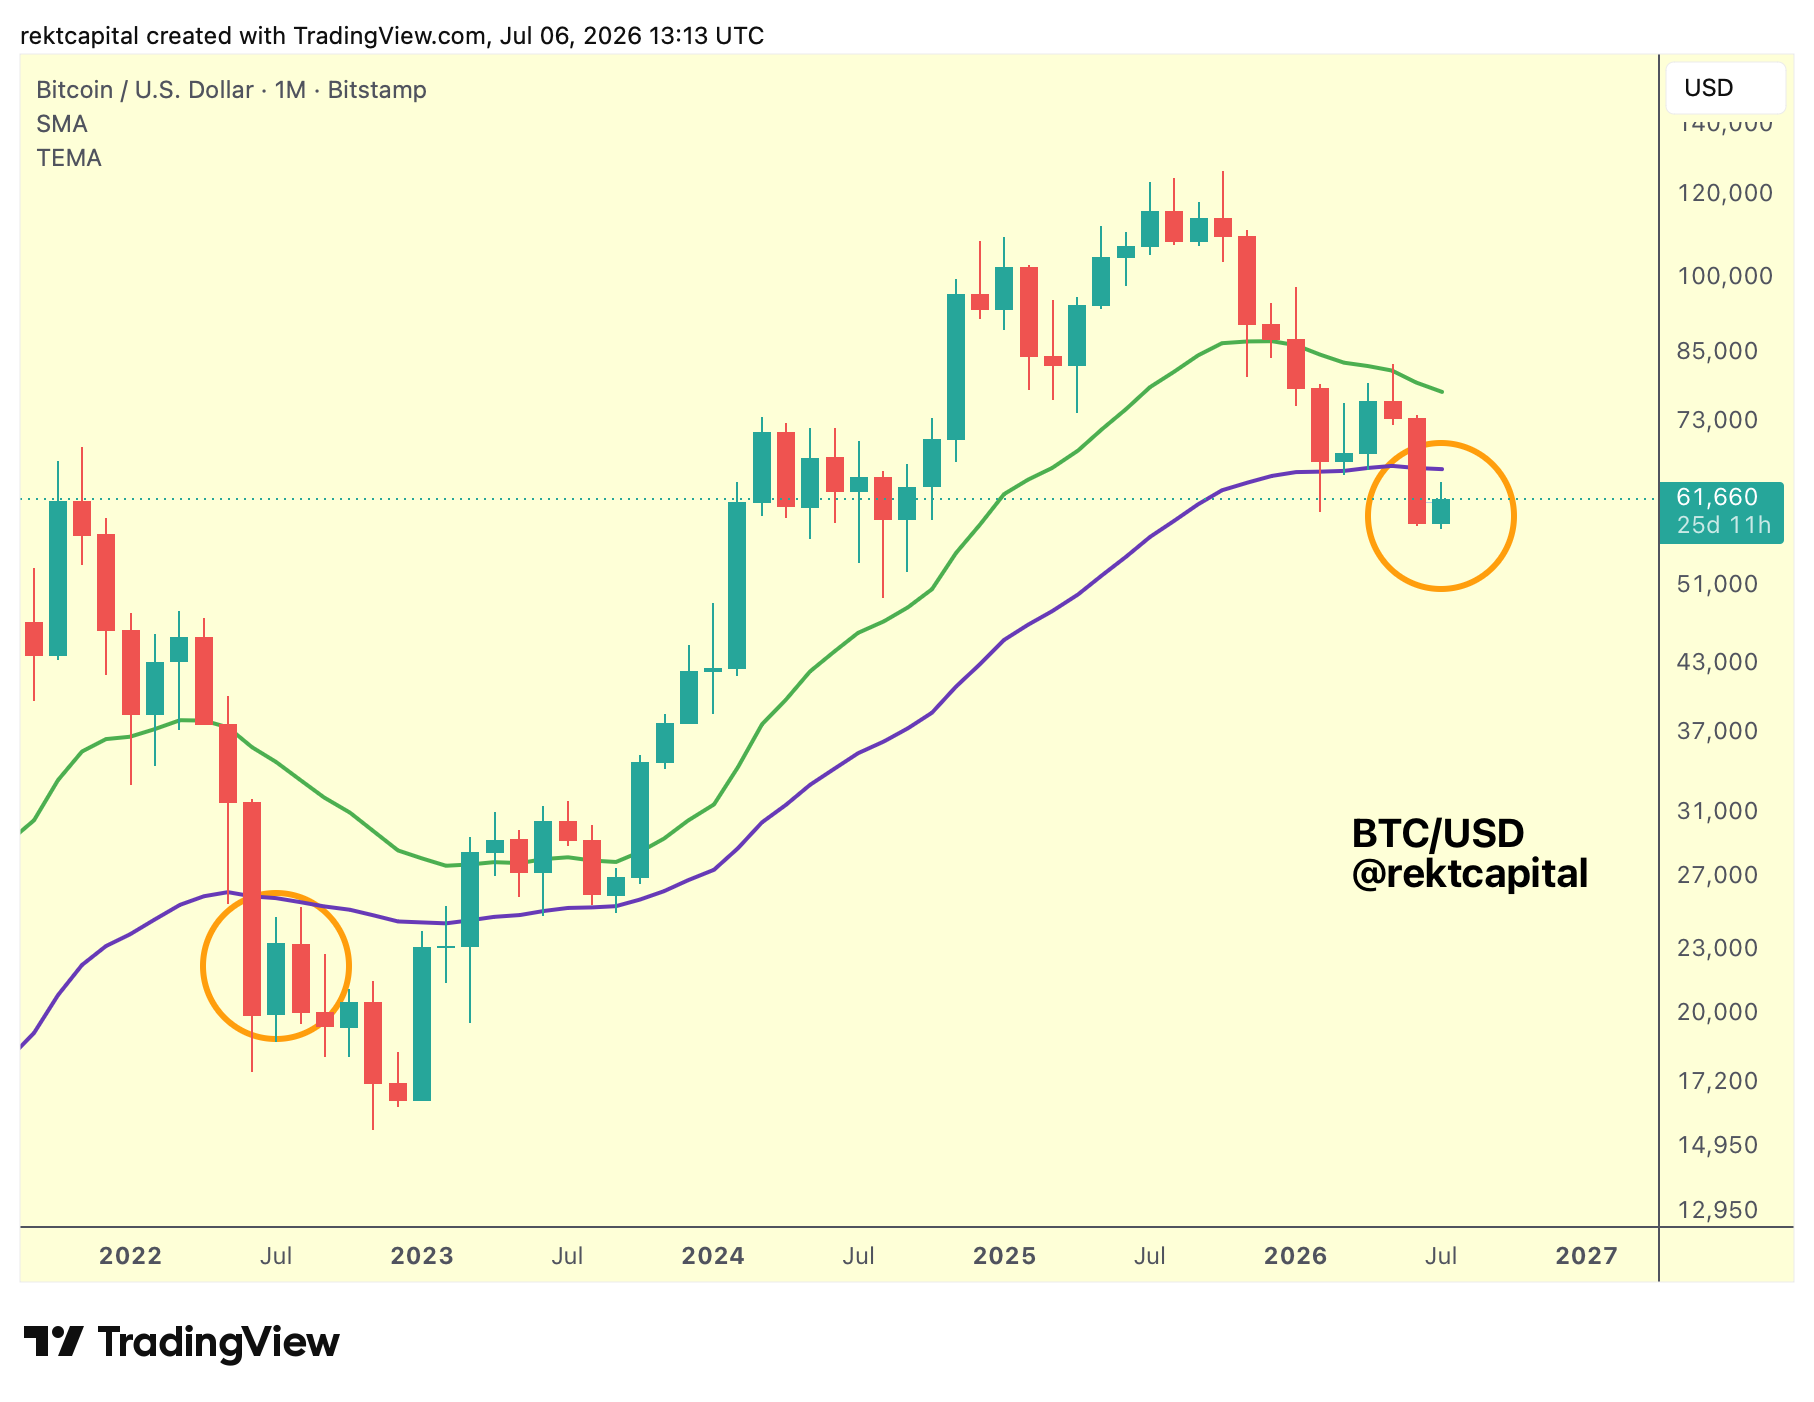
Zooming out to the Monthly timeframe, the picture centres on $66,000 (purple, 50-month EMA), the level that marked this year's three-month floor.
Price has now Monthly Closed below it, and that shift raises the question of whether this EMA is turning from floor into ceiling.
We've seen this exact sequence before.
Four years ago, the same pattern played out: a red June, a green July, then August stamping out whatever recovery July produced, ultimately developing into a redistribution range.
If that fractal repeats, the result is a redistribution range rather than a genuine reversal.
That distinction matters.
In a Bear Market, any relief rally within a range serves one purpose: building a new macro Lower High before price distributes to new lows.
Re-Accumulation only becomes relevant once the actual Bear Market bottom has printed.
Until then, every range that forms is redistribution, not accumulation.
So the broader structure hasn't shifted.
We're still testing old supports and watching those rallies weaken each time, still turning historically strong supports into new resistance, and still building macro Lower Highs before the next leg of distribution begins.
The short-term path into the 50-month EMA runs through the 200-week SMA.
A retest there could still produce higher highs, just enough bullishness to draw FOMO buyers into the market before a local top forms and price distributes below the SMA again, continuing the sequence of Lower Highs.
If Bitcoin reclaims the 200-week SMA, now framed around $62,000, that reclaim could enable one final revisit toward the 50-month EMA, perhaps into the high $60,000s, maybe $67,000 to $68,000, with some upside wicking.
It wouldn't amount to much of a move, but it would complete the last phase of this relief rally before local topping out.
Here's how the fractal ties together going forward: red June, green July, red August.
Whatever upside July delivers, August is likely to erase, retracing price back to where June ended and July began.
From there, the breakdown could begin in the second half of August, or the timeline could slip and the process could instead start in September.
Either way, the 200-week SMA on the Weekly and the 50-month EMA on the Monthly are telling the same story from two angles.
With short-term price tendencies on the Weekly funnelling directly into this broader Monthly picture.