Bitcoin - New Lower Highs Developing?
Bitcoin would ascend level by level in recent weeks, but is now losing those same levels
Welcome to the Rekt Capital Newsletter, a resource for investors who want to better navigate the crypto markets with the help of cutting-edge crypto research and unbiased market analysis.
***IMPORTANT ANNOUNCEMENT***
The new home for all Rekt Capital Newsletter content is now at https://newsletter.rektcapital.co.uk and our website is now at https://rektcapital.co.uk.
Please bookmark and whitelist these two websites.
You will still receive newsletters as normal - straight into your inbox, three times a week but if you’d like to access the newsletters online please visit our new website https://newsletter.rektcapital.co.uk
From Support to Resistance: The 21-Week EMA Has Flipped
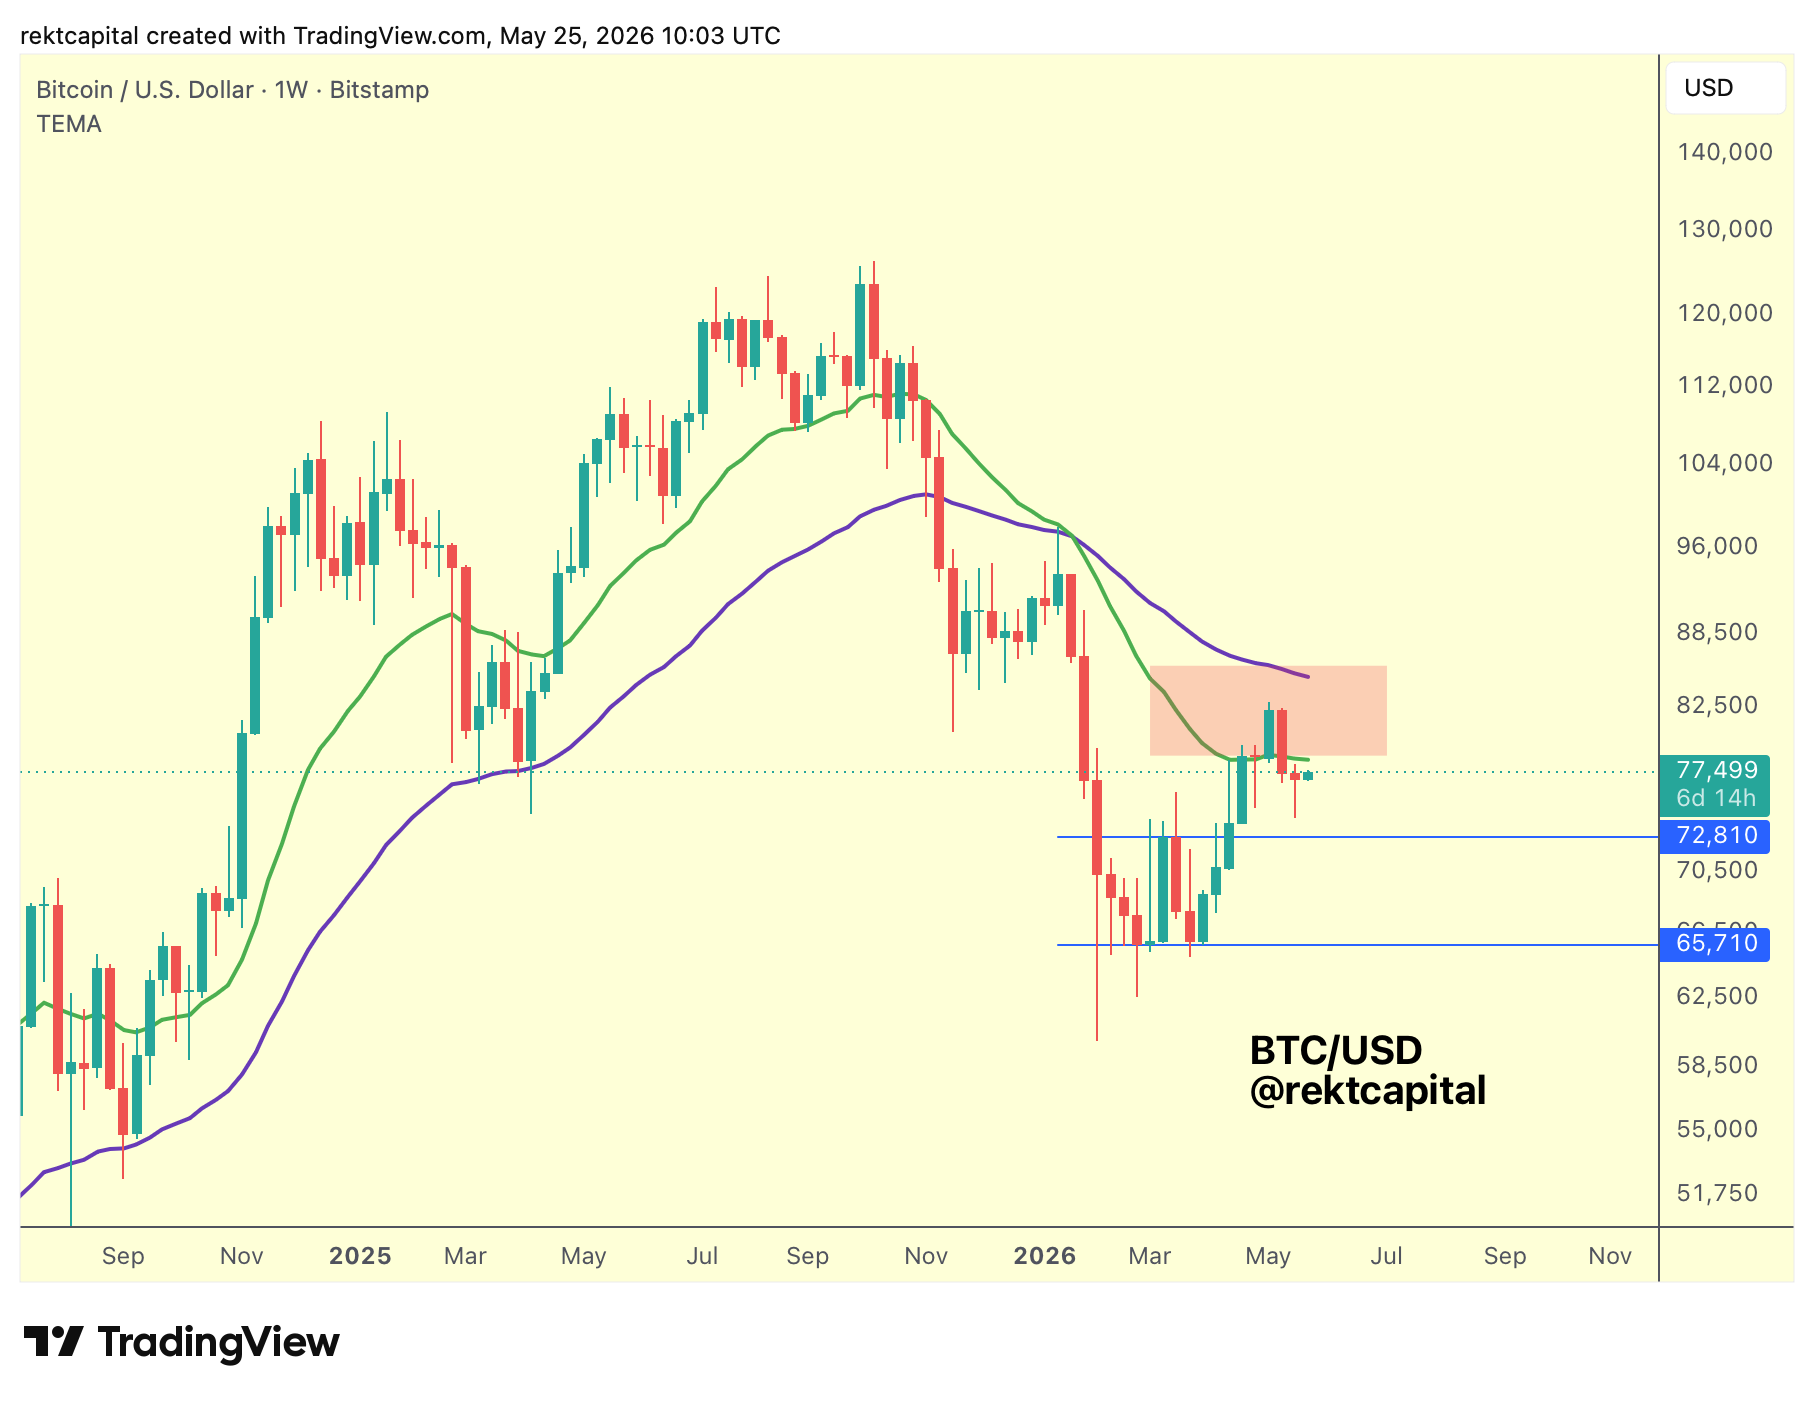
Both the purple 50-Week EMA and the green 21-Week EMA are functioning as a supply zone at this stage of the cycle and that dynamic is now playing out in real time.
Price has Weekly Closed beneath the 21-Week EMA for two consecutive weeks, positioning for a bearish retest from the underside.
What makes this particularly notable is the contrast with just weeks prior, when the 21-Week EMA was holding as consecutive support.
The relationship has inverted. What was a floor is now threatening to become a ceiling.
Continued rejection from this EMA could force price down into the top of the Weekly Double Bottom formation at $72,810 (blue horizontal).
The Post-Breakout Retest that would fully confirm the breakout from that structure.
We already saw retesting intent in last week's candle, with a downside wick reaching toward that region.
That pocket of liquidity remains untapped and could still be visited to complete the confirmation.
The Double Bottom itself produced slightly more than a 1:1 Measured Move — and that kind of overshoot is precisely what tends to precede a pullback into the old resistance as new support.
The retest is not a sign of failure. It is part of the process.
What is worth noting, however, is how extended and time-consuming this entire sequence has become.
From formation to Measured Move to breakout, each phase has taken weeks longer than one might expect.
Confirming the breakout will likely take additional weeks.
And should that confirmation fail, resynchronising with the broader range — between the Double Bottom's $65,710 (blue horizontal) low and its $72,810 top — would add yet more weeks to the timeline.
In the meantime, Lower Highs continue to develop. The downtrend is being respected.
Whether the Double Bottom ultimately confirms remains to be seen but the clock is running, and the 21-Week EMA above is making the path back considerably harder.
The CME Gap - New Resistance?
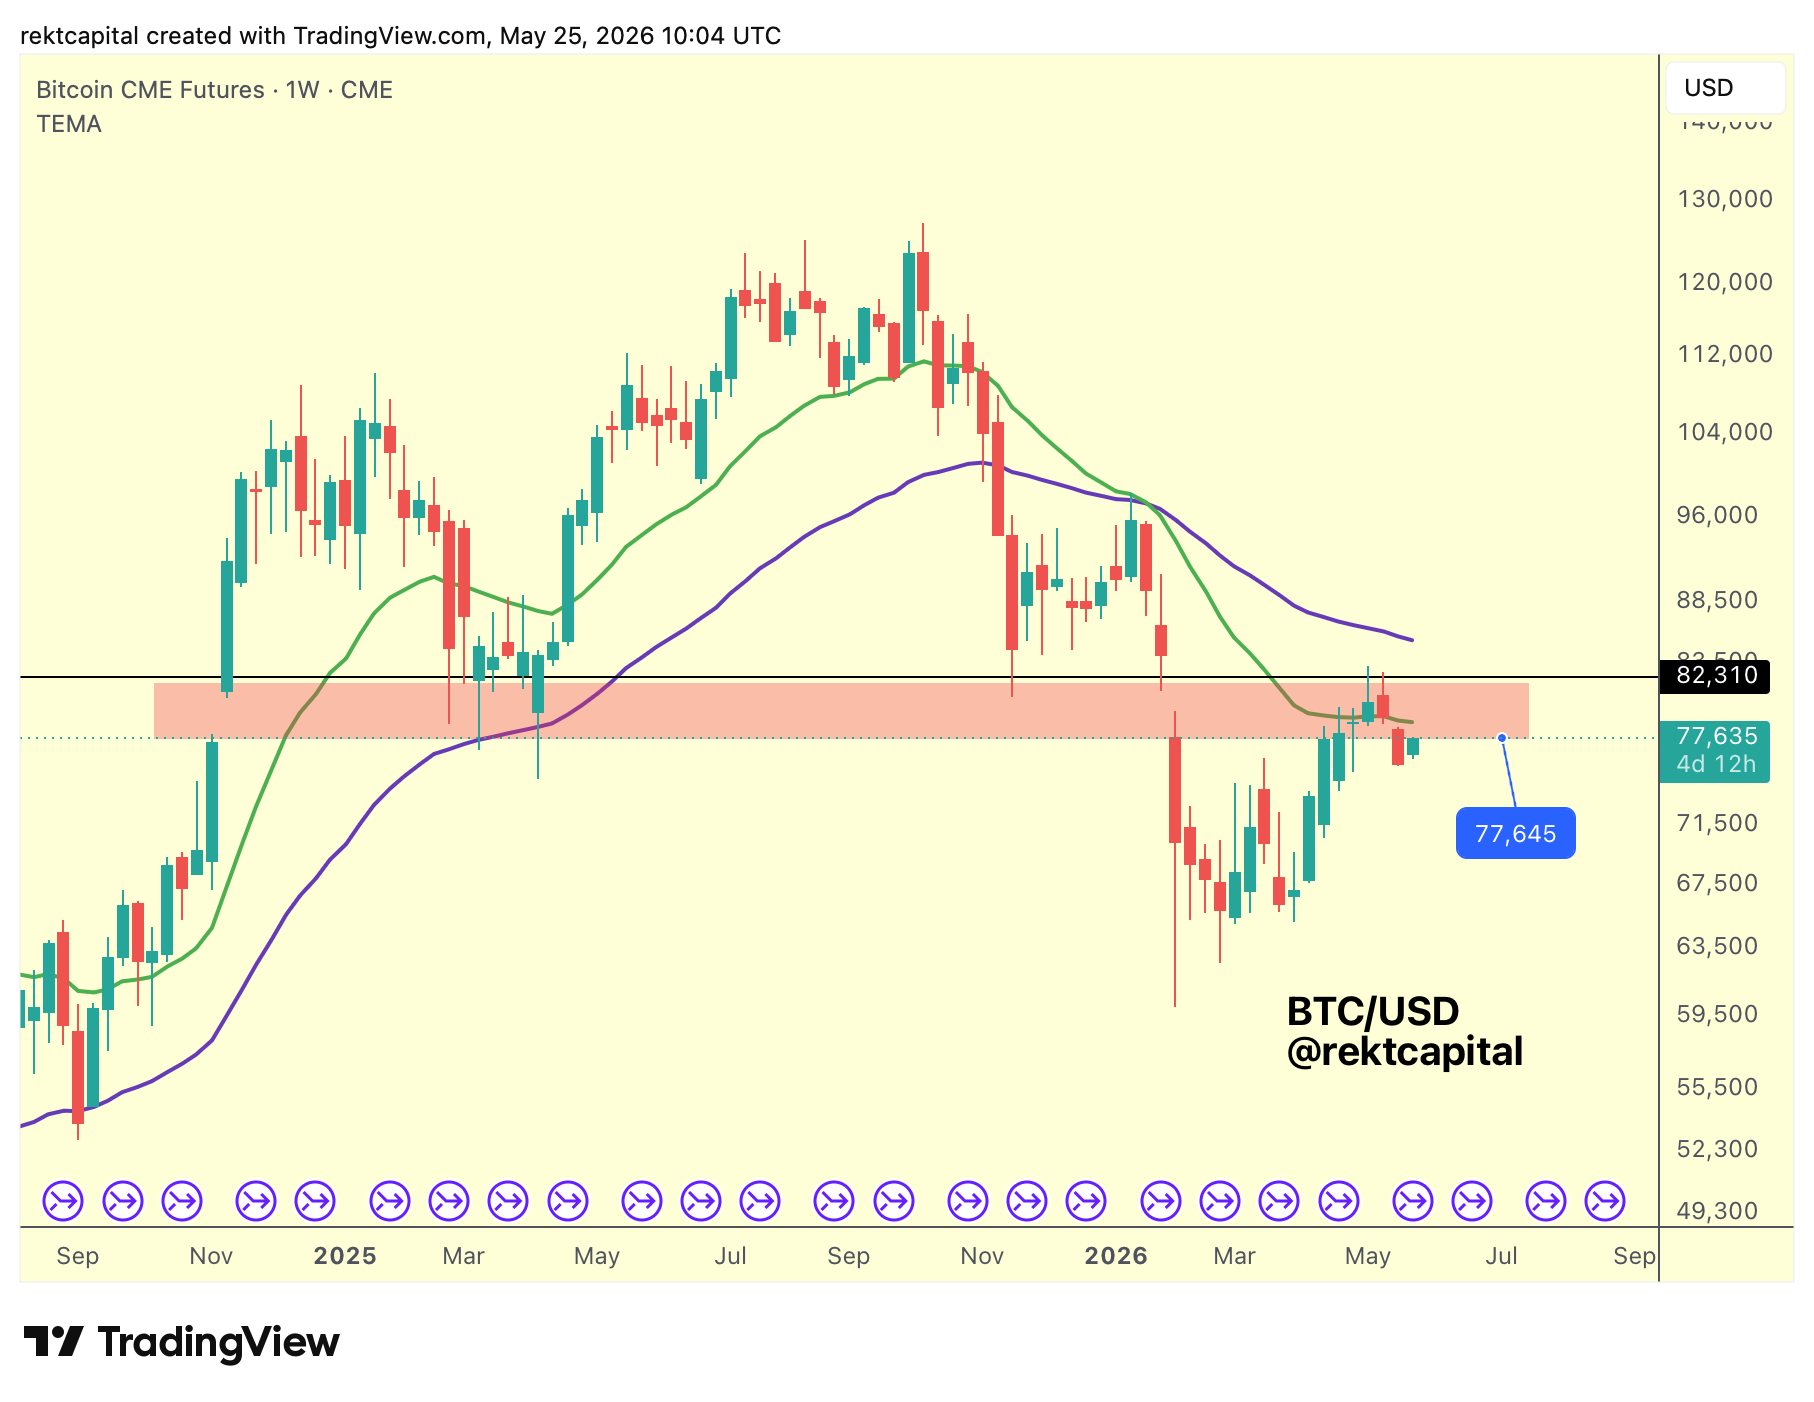
The Weekly CME gap at $82,310 (red horizontal zone) has been filled on several occasions — most notably a few weeks back — but each attempt to reclaim it as support has failed.
Price Weekly Closed beneath the gap, and what was once a target has now flipped.
Rather than holding inside the range, price rallied from the Range Low to the Range High within the gap, then dropped back to the Range Low without being able to establish support there once again.
The Range Low itself is now being threatened as a level to lose entirely.
The pattern is consistent and compounding.
Instead of gaining level by level — the CME gap, the order block, the 21-Week EMA — Bitcoin is losing them one by one.
And in doing so, it risks developing yet another Lower High in the process.