The Bitcoin Relief Rally - How Much More Upside Is Left?
What are the key resistances ahead?
Welcome to the Rekt Capital Newsletter, a resource for investors who want to better navigate the crypto markets with the help of cutting-edge crypto research and unbiased market analysis.
Bitcoin's Marginal Close: What It Really Means
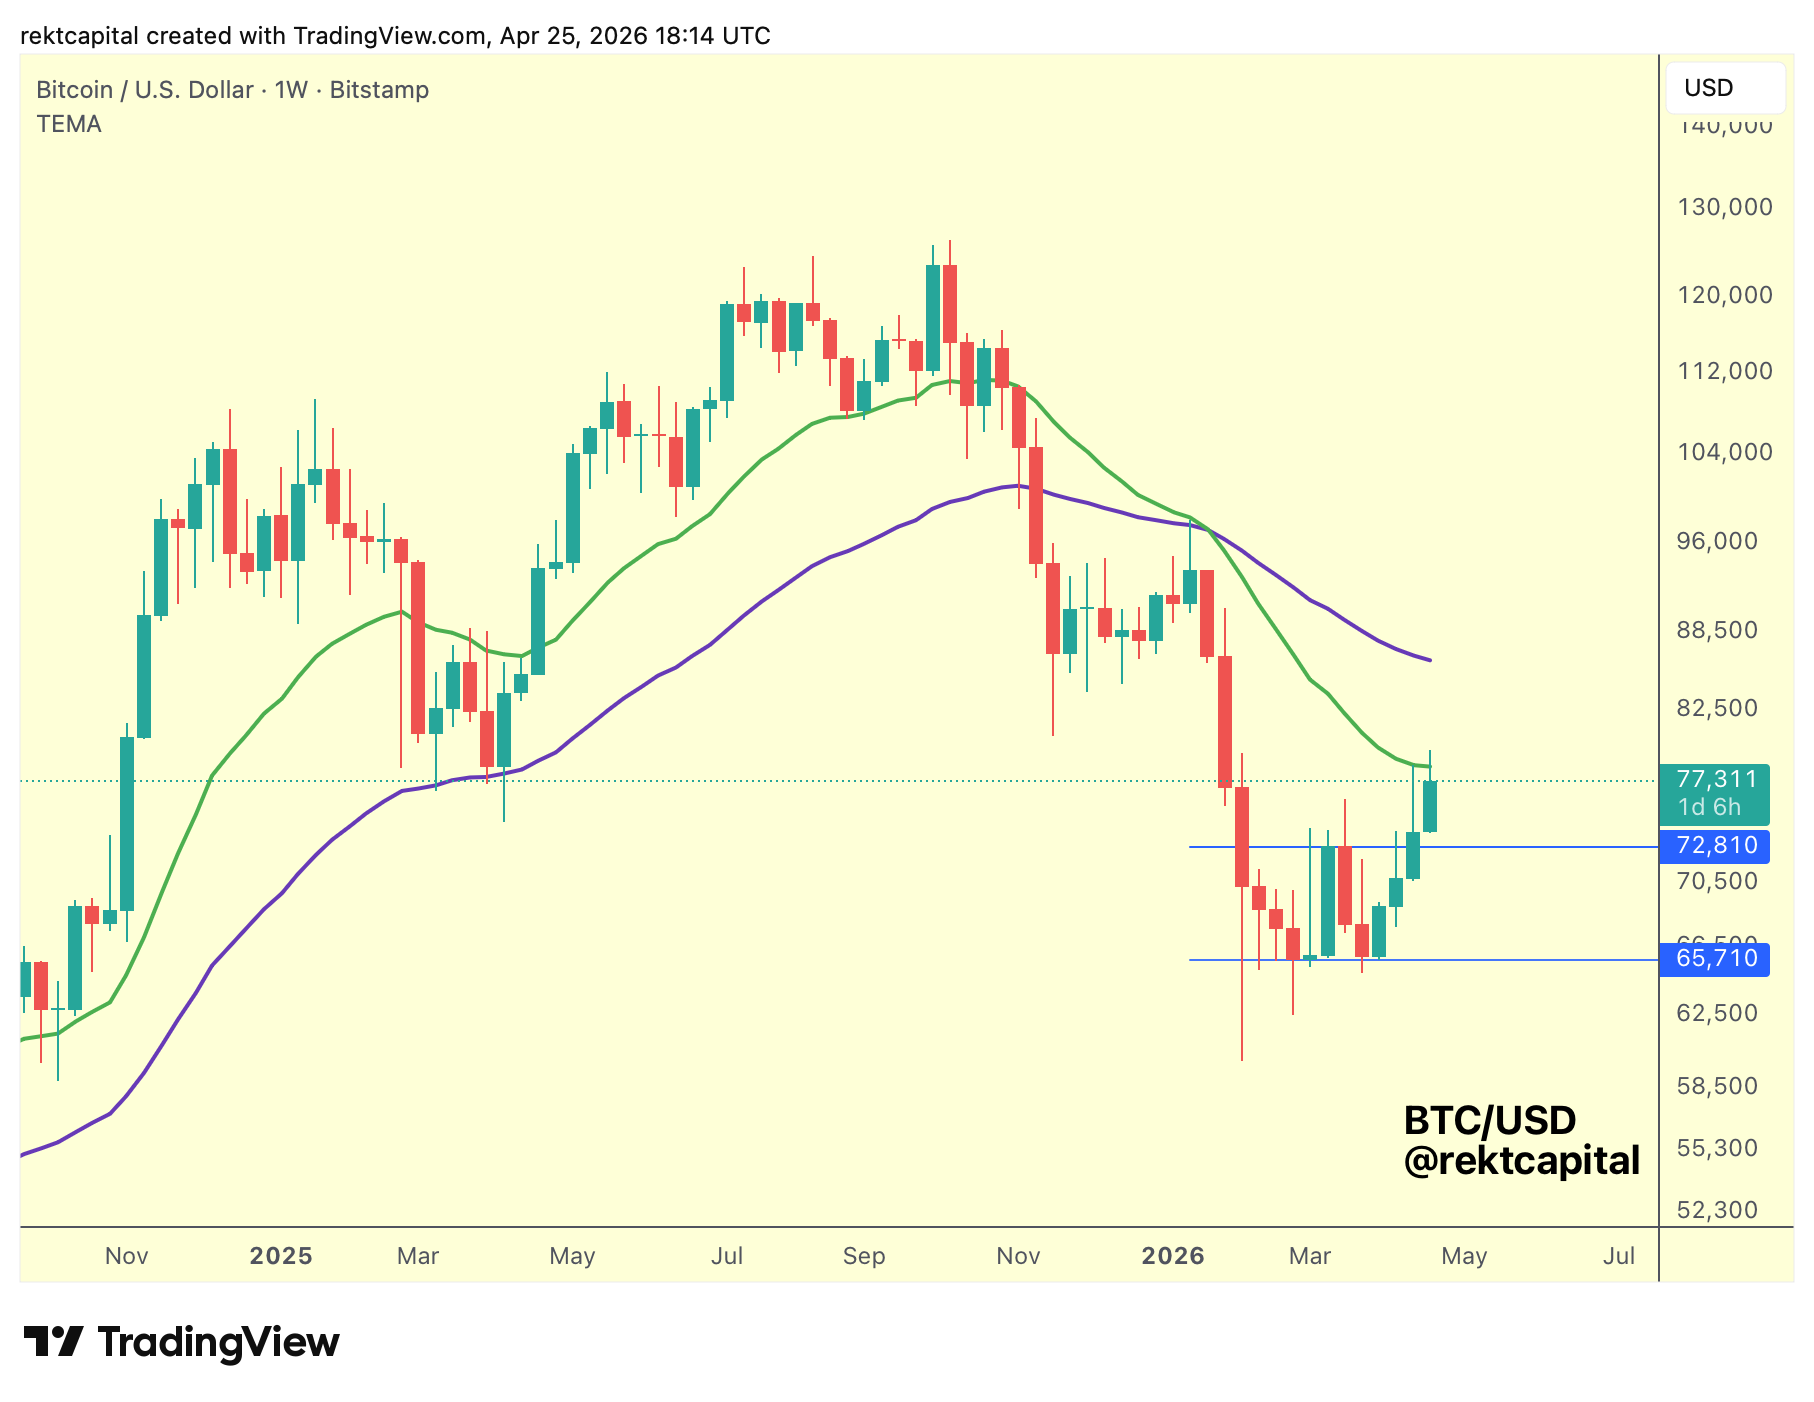
Just a few days ago, Bitcoin was resting below the 21-week EMA (green), upside wicking into it and still treating it as a ceiling.
That was the state of play coming into this Weekly Close.
That Weekly Close has changed the picture, marginally.
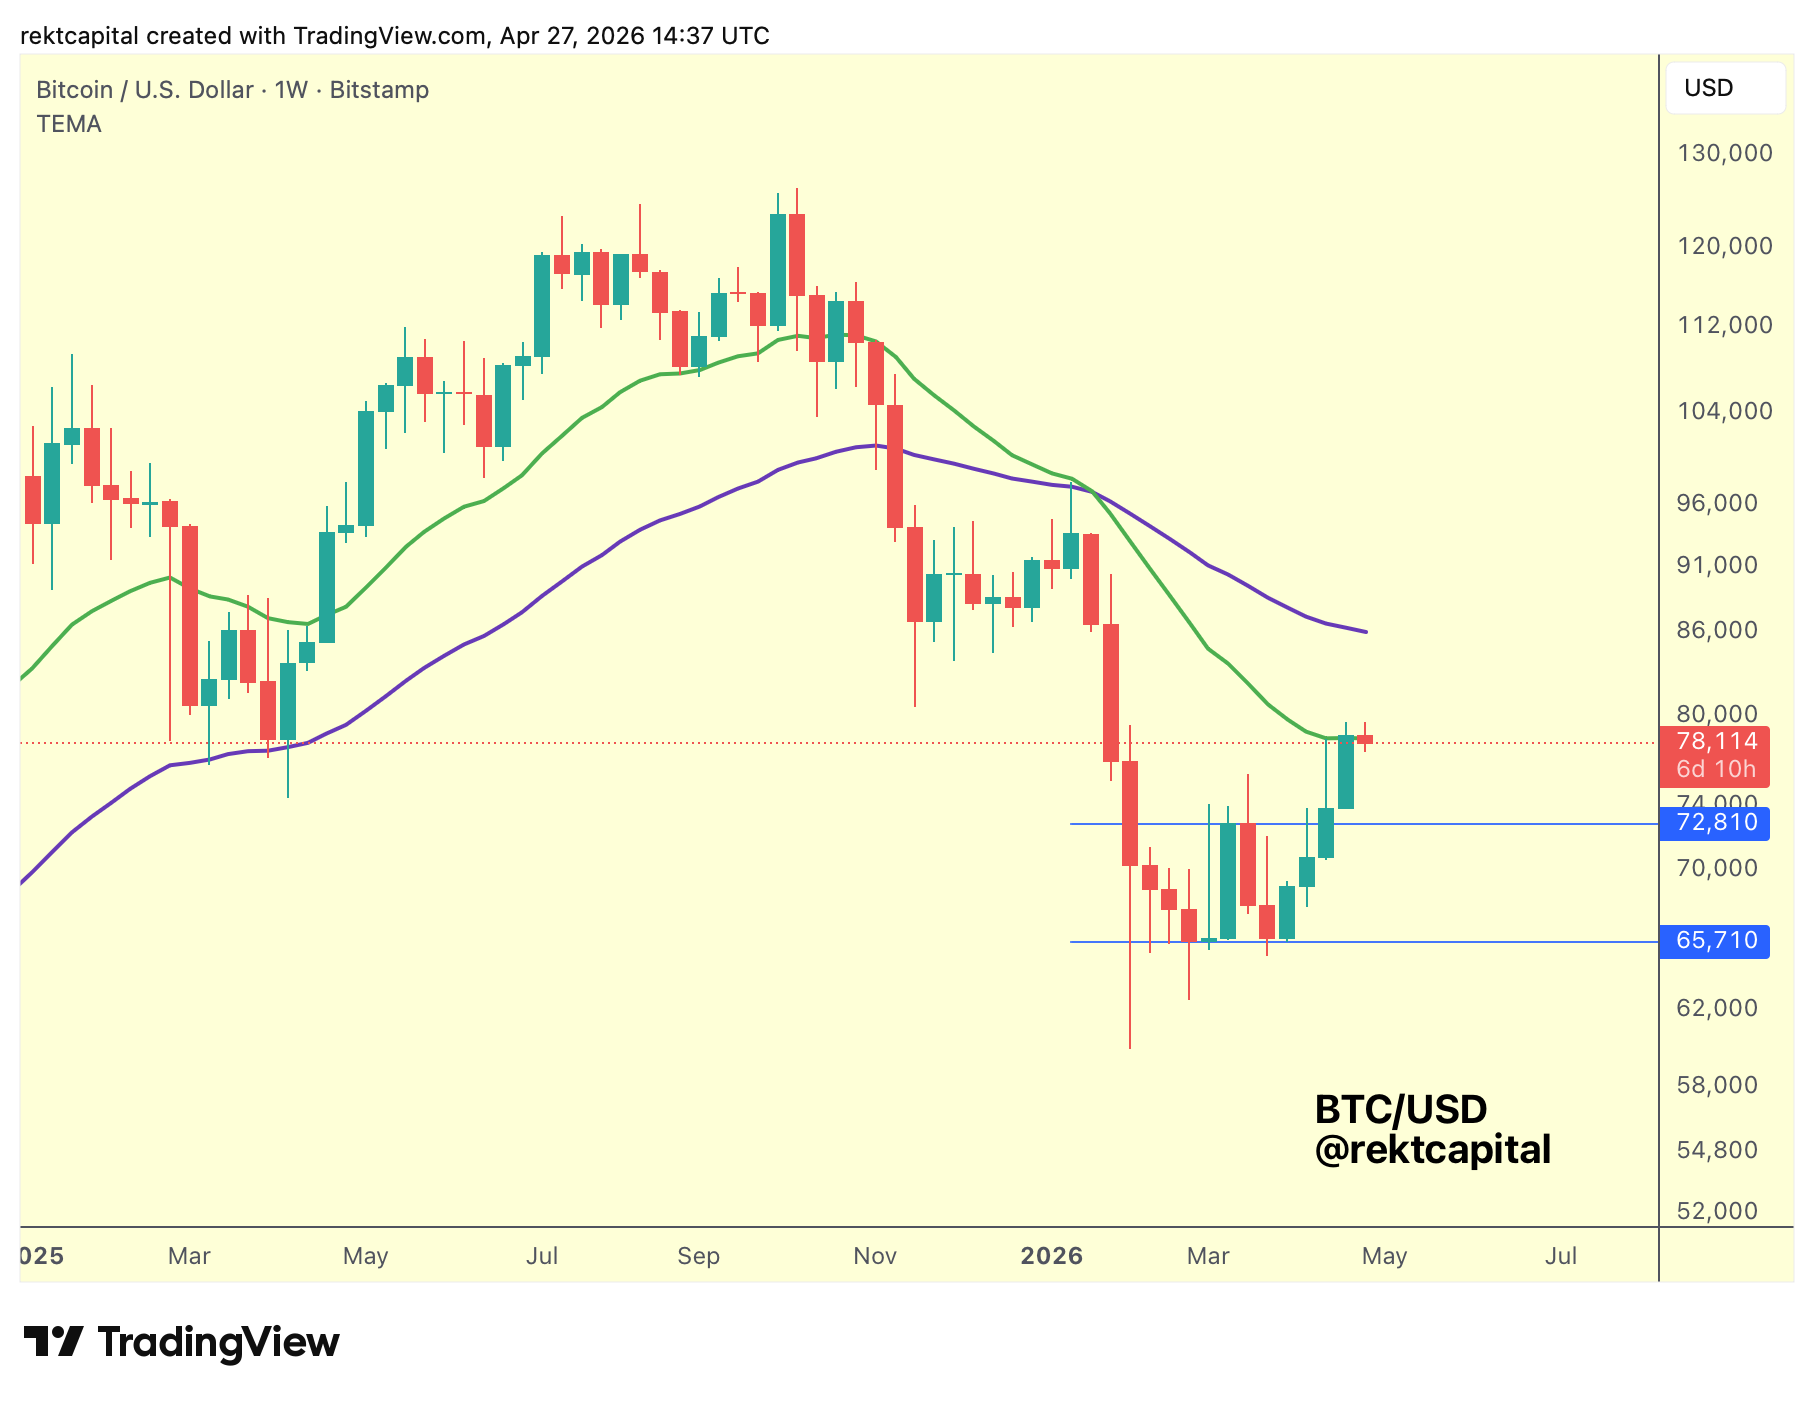
Price has seemingly closed just above the 21-week EMA (green), technically piercing it as a resistance for the first time, and positioning itself to attempt a reclaim of this level as new support.
The current pullback is price's way of trying to hammer out a base at that old ceiling.
The problem with marginal closes, however, is that they cut both ways.
Because the close is so marginal, the 21-week EMA can still be treated as a resistance in this context.
A clean Weekly Close above a level typically lands high enough to allow space for a volatile retest, enough room for price to dip below the level briefly and still recover above it.
With a marginal close, that buffer barely exists.
What that means in practice is that most of this retest is likely to play out beneath the EMA itself.
The candle body will spend the majority of its time below the retesting level, which does not improve the probability of a successful reclaim.
Such a retest simply has less room to perform.
That said, as long as price continues to consolidate in and around this level, the retest remains in progress and continues to gain credibility over time.
It is only through sustained price action here that the retest can establish itself as legitimate.
A stronger rejection, on the other hand, would give the answer immediately, the 21-week EMA remains a resistance, and the marginal close above it was not enough.
Should that rejection materialise, there is a floor worth watching.
Right now, price is sitting in the space between the 21-week EMA above and the top of the Double Bottom formation developing below.
That Double Bottom top is always going to be a potential level to monitor, a natural candidate for a retest of that broader structure if the EMA fails to hold as new support.