Altcoin Newsletter #280
Features analysis on Altcoins such as AERO SOL TIA LINK DOGE HBAR
Welcome to the Rekt Capital Newsletter, a resource for investors who want to better navigate the crypto markets with the help of cutting-edge crypto research and unbiased market analysis.
In today’s Altcoin newsletter I cover the following Altcoins – specifically:
- Aerodrome Finance (AERO)
- Solana (SOL)
- Celestia (TIA)
- Chainlink (LINK)
- Dogecoin (DOGE)
- Hedera Hashgraph (HBAR)
These Altcoin TA requests are made by valued readers of the Rekt Capital Premium Newsletter.
Let’s dive in...
Aerodrome Finance – AERO/USDT
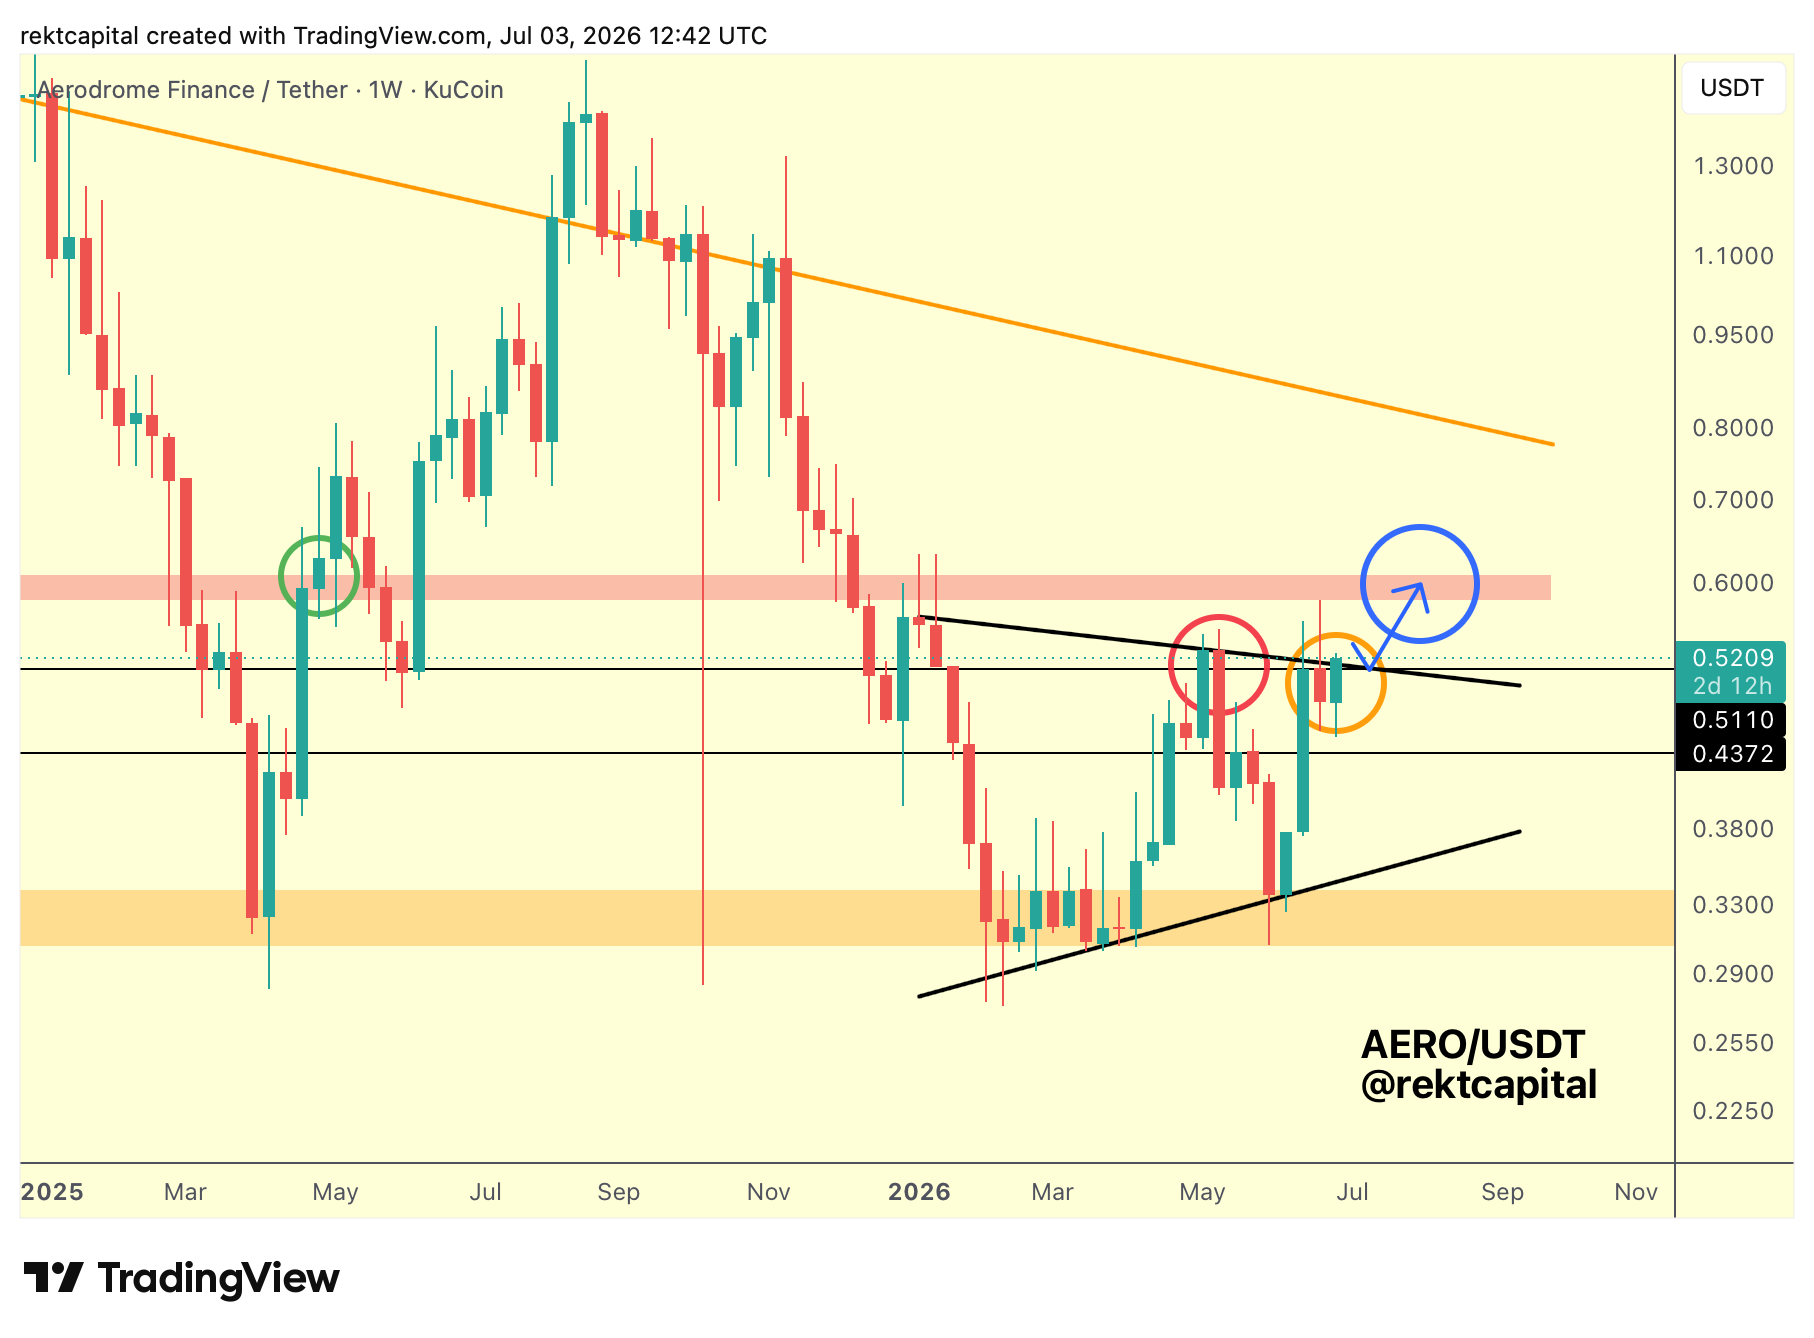
AERO is navigating a macro triangular structure, and price may be forming a Bull Flag around current levels.
To validate both the Bull Flag and a meaningful exit from the triangle, a Weekly Close above $0.5110 (black horizontal, confluent resistance) is required.
That $0.5110 level carries triple significance: it is the Bull Flag top, the Range High of the broader consolidation range, and the black descending Lower High trendline.
All converging at the same point.
A Weekly Close above this confluence, followed by a successful Post-Breakout Retest, would set up a challenge of $0.60 (red zone, macro resistance above).
At that red zone, price would need to Weekly Close within or above it and hold it across back-to-back weeks to sustain any rally attempt beyond that level.
The risk is consolidation.
The longer AERO lingers beneath the Lower High trendline without breaking above, the more this price action risks turning into a slow topping-out process.
A Weekly Close beneath the confluence complicates the setup considerably, so the weekly resolution here is the deciding factor.
$0.4372 (black horizontal, pivot support) remains the floor that keeps the upper portion of the triangle in play.
That has not changed.
Solana – SOL/USD
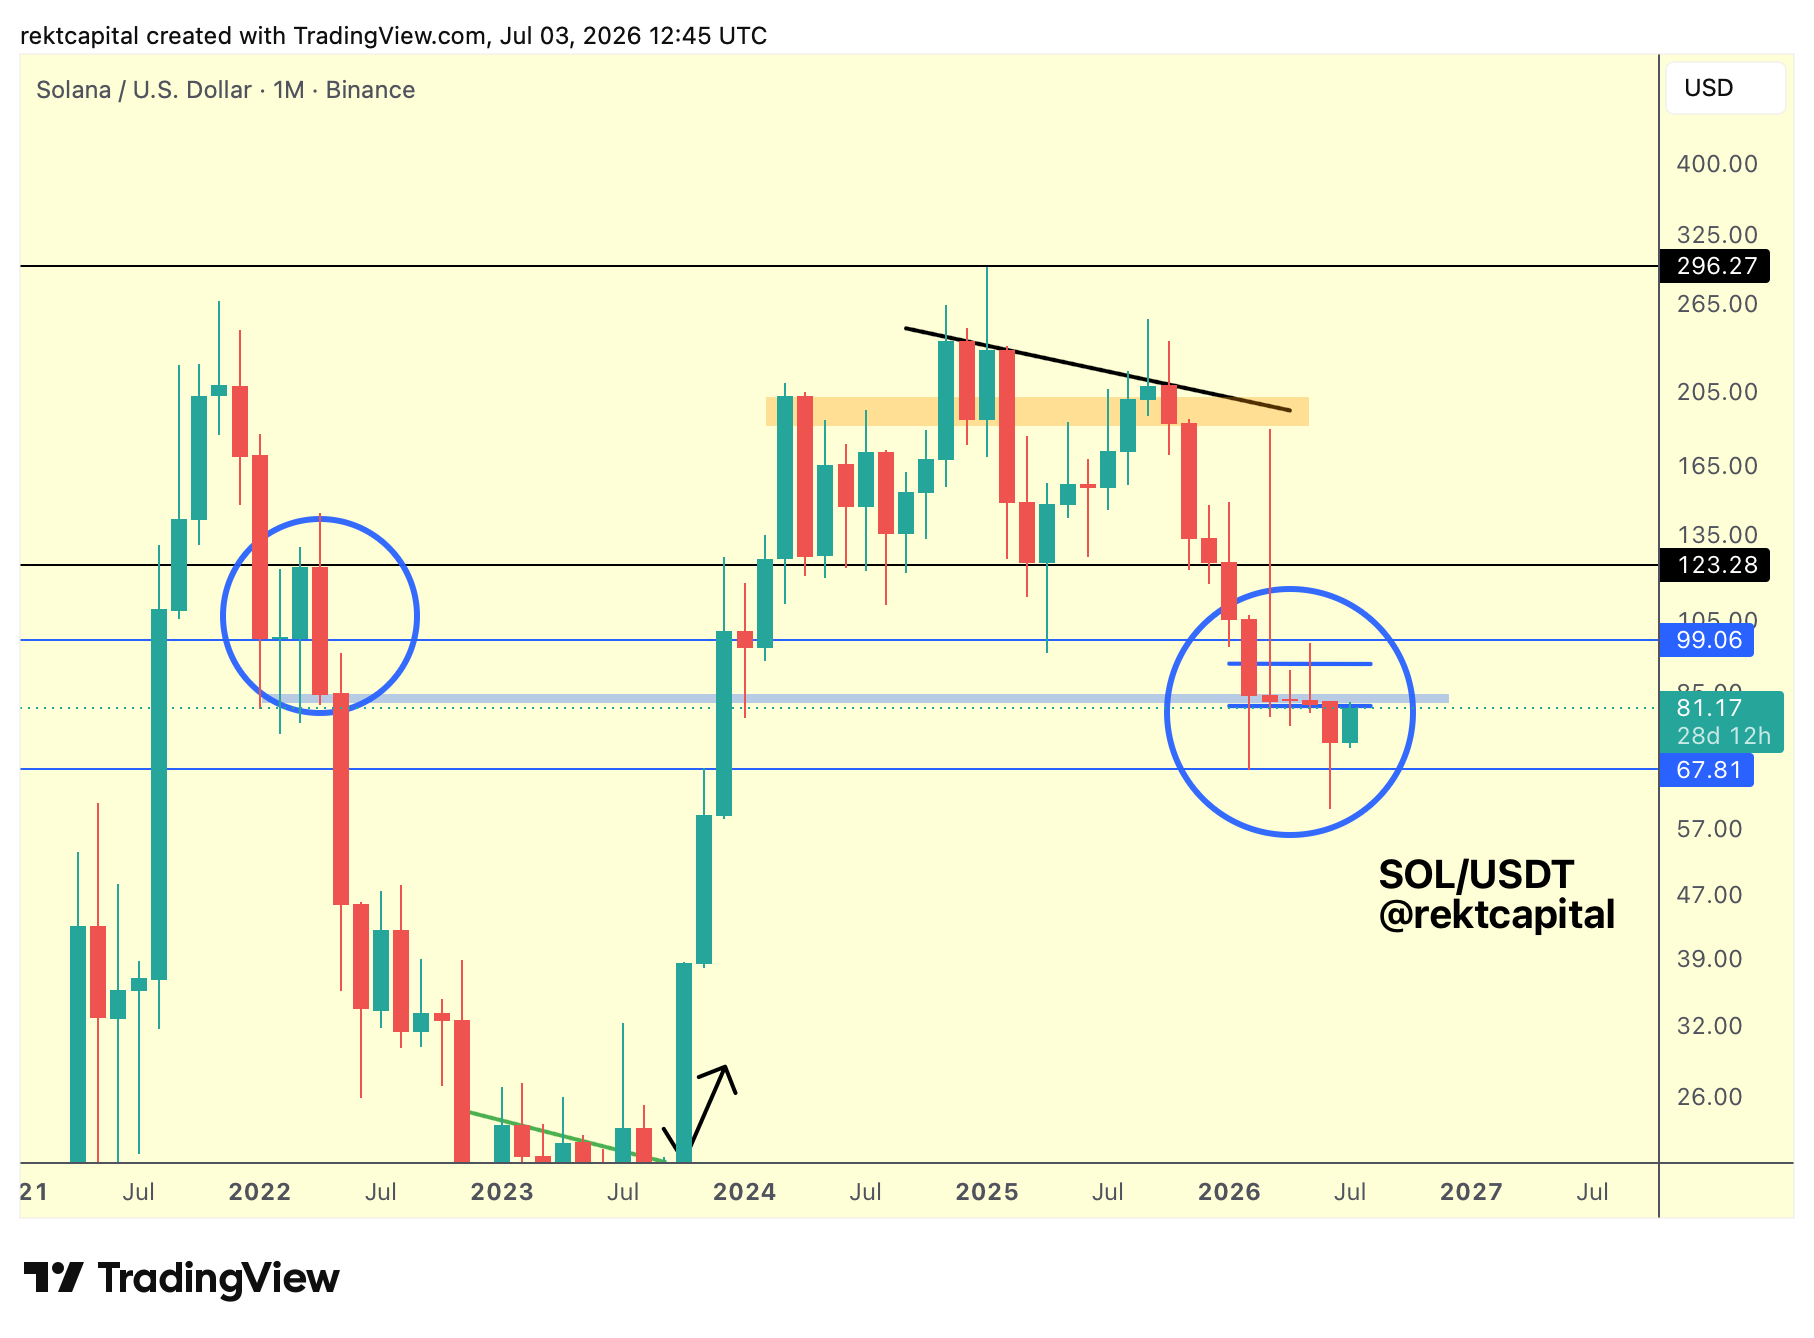
July is shaping up as a relief month for Bitcoin, and by extension, for altcoins including Solana.
The multi-month sideways channel that defined SOL's price action is now in the process of converting from demand into supply.
That transition is the central theme.
Price rebounded from the $67.81 (blue horizontal, downside wick low) level, but the most recent rally from there was already weaker than prior rebounds, an early sign that $67.81 is fading as support.
The $80–$99.06 (blue horizontal, macro pivot) region is the zone to watch.
Turning that band into supply is the key mechanism that would impose sustained sell-side pressure on $67.81 and ultimately send Solana to new lows over time.
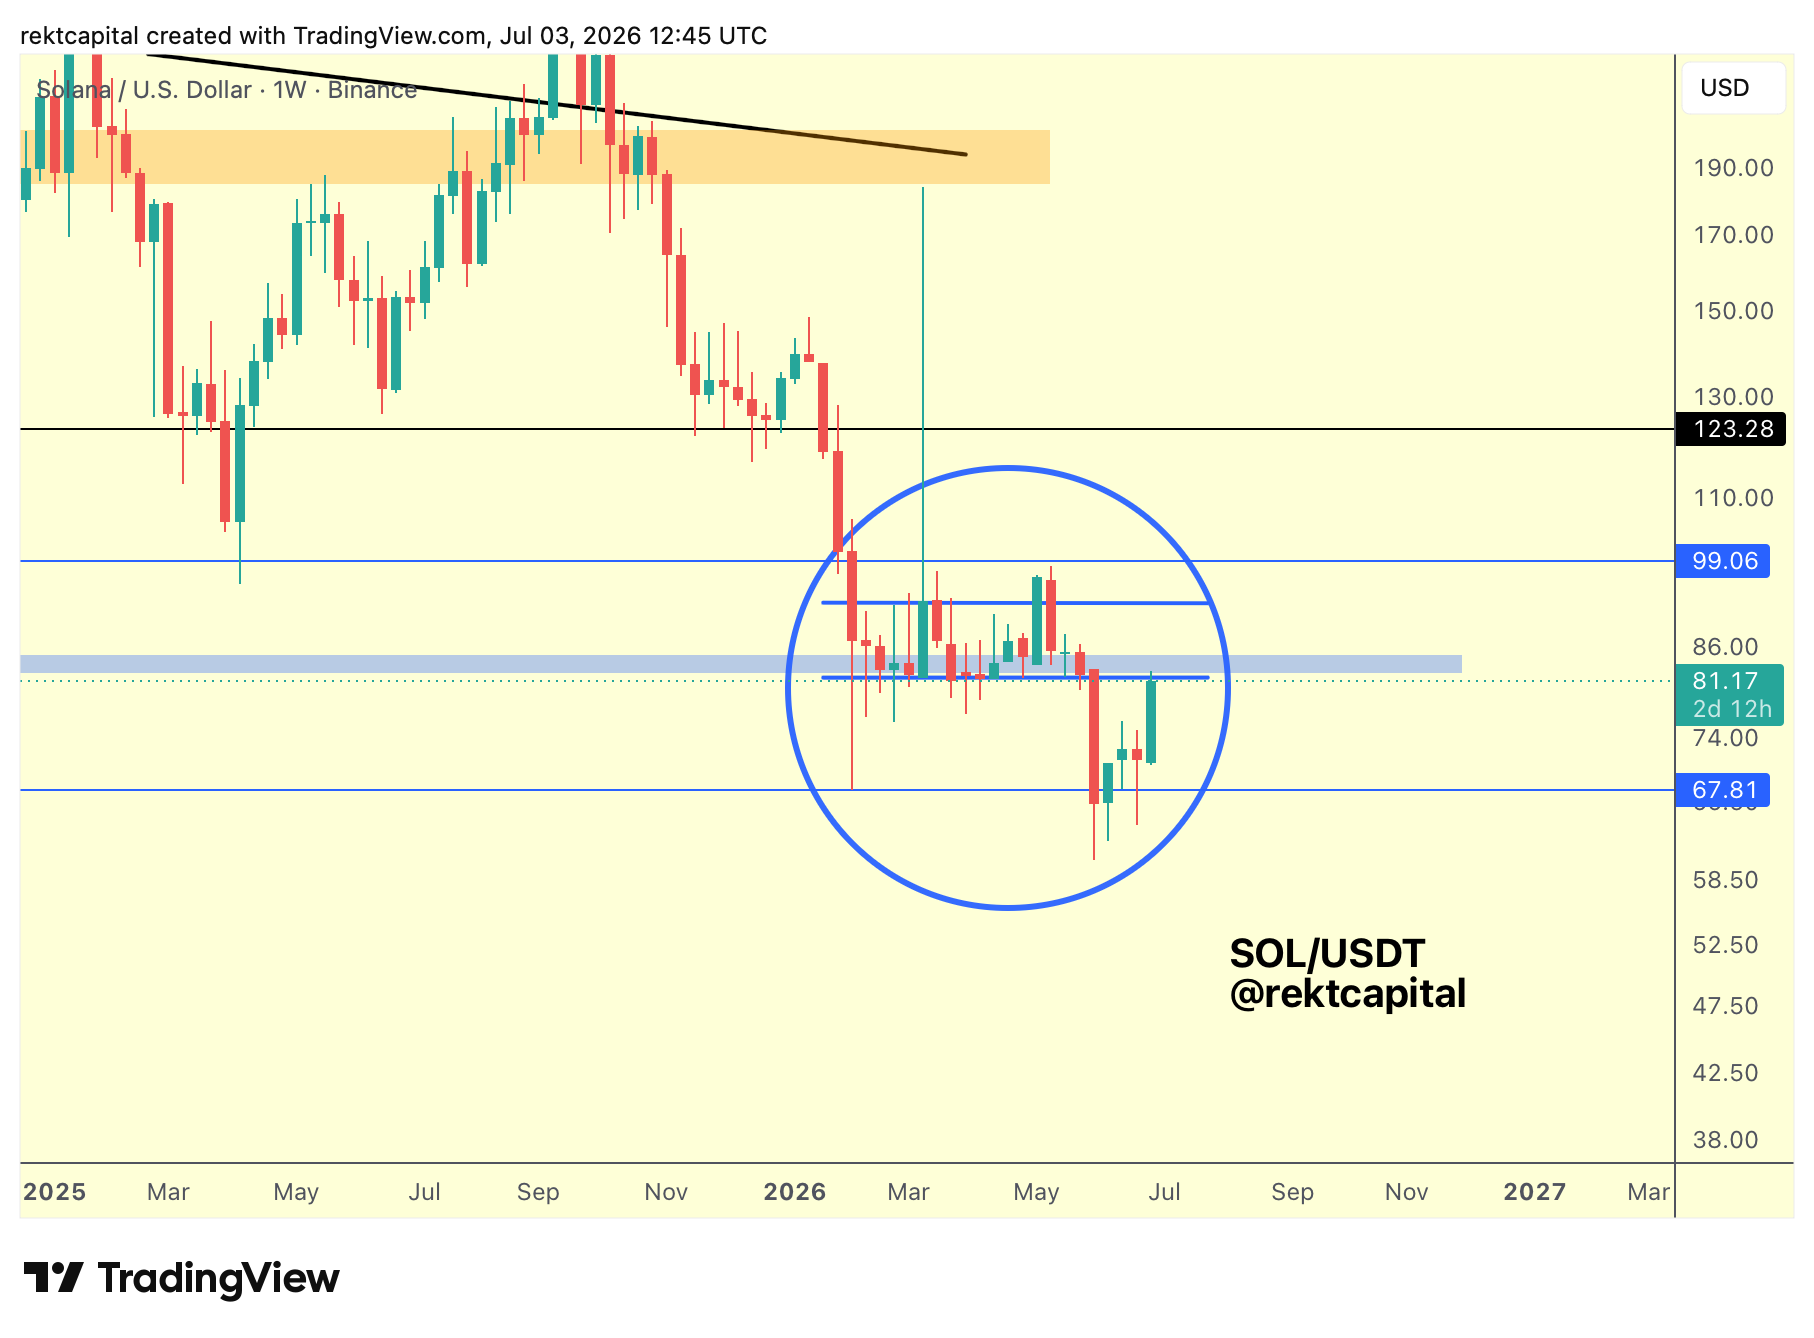
On the Weekly, price has rebounded from $67.81, developed Higher Lows, and is now pressing against the base of the broken channel structure.
A Weekly Close back inside that channel is possible.
But even that would not necessarily change the macro picture.
A Lower High developing within the channel could still confirm a breakdown in due course, for example, because if on the Monthly timeframe price Monthly Closes beneath the structure, this region would indeed transition into supply.
Long upside wicks have been a feature of Solana over the past several months, so some monthly volatility to the upside would not be out of the ordinary.
However, a Monthly Close beneath the channel, or an August failure even after any higher timeframe closes within it, remains the more likely outcome.
The old multi-month demand area is likely to become new supply, and that pressure will continue to bear down on $67.81 over time.